

Volume 12, Issue 4 (2-2027)
J Sport Biomech 2027, 12(4): 824-853 |
Back to browse issues page




Download citation:
BibTeX | RIS | EndNote | Medlars | ProCite | Reference Manager | RefWorks
Send citation to:


BibTeX | RIS | EndNote | Medlars | ProCite | Reference Manager | RefWorks
Send citation to:
Ghanim S R. Competitive Level Modulates Neuromuscular and Biomechanical Responses to Acute Clean-and-Jerk Fatigue: Elite versus Sub-Elite Weightlifters. J Sport Biomech 2027; 12 (4) :824-853
URL: http://biomechanics.iauh.ac.ir/article-1-574-en.html
URL: http://biomechanics.iauh.ac.ir/article-1-574-en.html


College of Physical Education and Sports Sciences, University of Samarra, Samarra, Iraq.
Keywords: Olympic weightlifting, Electromyography, Muscle fatigue, Motor coordination, Joint kinematics, Barbell velocity
Full-Text [PDF 1884 kb]
(9 Downloads)
| Abstract (HTML) (30 Views)

Full-Text: (7 Views)
Introduction
Olympic weightlifting requires rapid force production and precise coordination of whole-body movements while maintaining a controlled three-dimensional barbell trajectory (1–4). Phase-specific force production and lower-limb joint mechanics are closely associated with weightlifting performance (5, 6). The clean and jerk is particularly demanding because the pull and catch phases are followed by a second explosive movement, the jerk, which requires athletes to regain postural stability and execute a rapid dip-and-drive action under substantial external loads (7–9). Studies examining pulling-phase mechanics and recent investigations involving national- and international-level weightlifters have further highlighted the importance of technical proficiency throughout the first pull, transition, and second pull phases (10–12). Competitive level may therefore influence an athlete's ability to maintain technical consistency as fatigue develops. Elite weightlifters generally exhibit relatively low trial-to-trial variability in barbell kinematics, while movement organization differs across competitive levels (13, 14). Recent studies published in the Journal of Sport Biomechanics have also highlighted the importance of accurate barbell-velocity measurement and documented fatigue-related changes in coordination and sport-specific movement patterns (15–17). Collectively, these findings support an integrated assessment of barbell mechanics alongside neuromuscular and joint-kinematic responses.
Performance fatigability is task-specific and refers to an acute reduction in the capacity to sustain the force, power, or coordination required for a given task (18, 19). Surface electromyography (sEMG) provides complementary information regarding neuromuscular responses to fatigue. Under standardized acquisition and processing conditions, a reduction in median frequency (MDF) may reflect localized fatigue-related changes in muscle-fiber conduction properties, whereas muscle activation timing and coactivation measures may provide insight into changes in neuromuscular coordination (20–24). Nevertheless, sEMG recordings obtained during dynamic movements require cautious interpretation because muscle length, contraction velocity, electrode positioning, and movement artifacts can influence signal characteristics (22–24). Fatigue may also compromise technical execution before an athlete becomes unable to complete a lift. Previous research on the power clean and Olympic weightlifting has identified fatigue-related alterations in barbell velocity, force-production characteristics, and barbell trajectory, while redistribution of rest periods may attenuate some of these changes (25–27). However, whether these responses differ according to competitive level during the complete clean-and-jerk movement remains unclear. In particular, limited research has simultaneously examined physiological responses, phase-matched sEMG activity, joint kinematics, and barbell trajectory in elite and sub-elite weightlifters performing an identical acute fatiguing protocol.
Accordingly, the primary aim of this study was to determine whether competitive level influences fatigue-related changes in barbell mechanics and neuromuscular activation timing during the clean and jerk. Secondary aims were to characterize physiological and performance-related responses to fatigue and to explore changes in joint kinematics and sEMG-derived measures. We hypothesized that sub-elite weightlifters would exhibit greater reductions in peak barbell velocity during the clean and jerk, larger decreases in rectus femoris median frequency (RF-MDF), and greater increases in muscle activation onset-time variability than elite weightlifters. An exploratory pooled multivariable regression analysis was also conducted to examine whether changes in RF-MDF, knee angle during the jerk dip, rectus femoris–biceps femoris (RF–BF) coactivation, and competitive level were associated with acute reductions in jerk velocity.
Methods
Study Design and Participants
A 2 (competitive level: elite vs. sub-elite) × 2 (time: pre- vs. post-fatigue) mixed experimental design was employed. Competitive level was the between-participant factor, and time was the within-participant factor. Participants completed familiarization and one-repetition maximum (1RM) verification before the experimental session. Physiological, neuromuscular, joint-kinematic, and barbell-kinematic measurements were obtained before and within a standardized four-minute window following a clean-and-jerk fatigue protocol. This four-minute window was protocol-driven rather than intended to represent a physiological recovery threshold. It allowed assessments to be conducted in a fixed sequence with consistent timing across participants, thereby minimizing timing-related measurement variability while capturing the early post-exercise fatigue state (27). Twenty-eight competitive weightlifters completed the study, including 14 elite and 14 sub-elite athletes. The eligible age range was 18–30 years, selected to minimize age-related heterogeneity while representing a typical competitive age range. This was an operational eligibility criterion rather than a federation-defined age category. Additional inclusion criteria were active training in the snatch and clean and jerk, technical proficiency in the full clean-and-jerk movement, and the absence of a current musculoskeletal injury that restricted lifting. Both male and female athletes were eligible to ensure that the sample reflected the broader competitive population rather than a single-sex cohort. The observed sex distribution was identical across competitive levels (10 men and 4 women per group). This distribution was not imposed as a sex-specific recruitment quota, and the study was not powered to investigate sex-specific effects. Participants were classified a priori using a predefined composite system incorporating verified competitive achievement, body-mass-adjusted performance, and structured Olympic-weightlifting experience. Elite weightlifters were required to meet at least two of the following three criteria: (a) active competitive registration, with a top-three placing at a national championship and/or previous participation in international competition under a recognized weightlifting federation; (b) a verified competition Sinclair Total > 360 points for men or > 260 points for women; and (c) at least five years of continuous structured Olympic-weightlifting training, with a habitual frequency of at least five sessions per week. Sub-elite weightlifters competed at the regional or provincial level without national-team selection or a top-three national placing, had verified Sinclair Totals of 280–340 points for men or 190–240 points for women, and had completed 2–4 years of structured training at a frequency of 3–4 sessions per week. Athletes with intermediate Sinclair Totals (341–360 points for men or 241–260 points for women) or discordant competitive and training classifications were excluded. Sinclair values were calculated from verified competition totals (snatch + clean and jerk) and body mass. Variables incorporated into the classification system, including training experience, competition standard, Sinclair performance, and strength level, were considered descriptors of competitive level rather than independent experimental findings.
A formal a priori sample size calculation was not performed because recruitment was constrained by the availability of actively competing weightlifters who met the predefined and deliberately separated competitive-level criteria. To characterize the precision limitations of the achieved sample, a post hoc sensitivity analysis was performed using conventional power-analysis methods (28). With 14 participants per group, a two-sided α = 0.05, and 80% power, the study was sensitive to a standardized between-group difference in change scores of approximately d = 1.10. For the pooled regression model with four predictors (N = 28), the minimum detectable incremental effect was approximately f² = 0.52, corresponding to R² ≈ 0.34 under the specified model. Accordingly, the study was primarily capable of detecting large effects, and smaller effects may have remained undetected. The multivariable regression was therefore considered exploratory rather than confirmatory. The study was approved by the Scientific Research Ethics Committee of the College of Physical Education and Sports Sciences, University of Samarra (Approval No. 32; January 18, 2026). Written informed consent was obtained from all participants before data collection, and all procedures were conducted in accordance with the Declaration of Helsinki.
Instrumentation and Data Acquisition
Surface electromyography (sEMG) was recorded continuously from the dominant side using a 16-channel Trigno Avanti Wireless System (Delsys Inc., Natick, MA, USA) at a sampling frequency of 2,000 Hz. Lower-limb dominance was defined as the preferred leg for kicking a ball, consistent with a commonly used task-specific approach to determining leg dominance (29). Upper-limb dominance was determined by self-report. When necessary, excess hair was removed, the skin was lightly abraded, and electrode sites were cleaned with 70% isopropyl alcohol. Dry Trigno sensors were aligned with muscle-fiber orientation over the vastus lateralis (VL), rectus femoris (RF), biceps femoris (BF), gluteus maximus (GM), medial gastrocnemius (MG), erector spinae at approximately L3 (ES), anterior deltoid (AD), and upper trapezius (UT), following standardized anatomical placement procedures (21). Sensors were secured using manufacturer-compatible adhesive interfaces, with additional cohesive fixation when necessary to minimize movement artifacts. Three-dimensional bilateral joint kinematics and barbell trajectories were recorded using an eight-camera Vicon Vantage V5 motion-capture system (Vicon Motion Systems Ltd., Oxford, UK) operating at 250 Hz. The calibrated capture volume, approximately 4.0 × 2.5 × 2.5 m, encompassed the lifting platform. A modified full-body Plug-in Gait marker configuration was used, incorporating standard anatomical markers supplemented by rigid thigh and shank clusters. Lower-limb and pelvic landmarks included the anterior and posterior superior iliac spines, lateral femoral epicondyles, lateral malleoli, calcanei, and second metatarsal heads. Trunk and upper-limb landmarks included C7, T10, the clavicular notch, sternum, acromioclavicular regions, lateral humeral epicondyles, and radial and ulnar styloid processes. Four additional retroreflective markers were attached symmetrically to the barbell collar sleeves to reconstruct the three-dimensional barbell trajectory. High-speed sagittal-plane video was recorded at 250 frames/s using a Sony RX100 VII camera (Sony Corp., Tokyo, Japan) to support verification of movement-phase boundaries.
Capillary blood lactate concentration was measured using a Lactate Pro 2 LT-1730 analyzer (ARKRAY Inc., Kyoto, Japan) from a 0.3-µL fingertip blood sample. The analyzer has previously undergone point-of-care validation (30). Countermovement jump performance was assessed using a PASCO 2-Axis Force Platform (PASCO Scientific, Roseville, CA, USA) operating at 1,000 Hz, with data acquisition controlled by PASCO Capstone software, version 2.4. Takeoff velocity was calculated by integrating the net vertical impulse, and jump height was subsequently determined using the equation h = v_takeoff²/(2g), where g = 9.81 m/s² (31). Peak mechanical power was determined using normalized center-of-mass velocity and normalized vertical force. A common transistor–transistor logic (TTL) pulse was recorded by both the sEMG and motion-capture systems to synchronize the acquired signals. This shared event marker enabled temporal alignment of muscle activation, joint movement, and barbell events. Phase transitions were additionally verified using high-speed video.
Experimental Procedures and Fatigue Protocol
Participants were instructed to avoid strenuous resistance exercise for 48 h, alcohol consumption for 24 h, and caffeine intake for at least 3 h before testing. They were also asked to maintain their usual pre-session meal and hydration routines. Before testing, participants completed a supervised dynamic warm-up followed by progressive clean-and-jerk loading. The original protocol documentation did not retain an exercise-by-exercise description of the warm-up; therefore, specific upper- and lower-limb exercises were not reconstructed retrospectively. This limitation was acknowledged to avoid introducing procedural details that had not been prospectively documented. Progressive clean-and-jerk attempts were performed at approximately 40%, 60%, 75%, and 85% of the participants' self-reported 1RM. Loads were subsequently increased in increments of 2.5–5.0 kg until the highest technically correct lift was identified, with at least 3 min of recovery between near-maximal attempts. Familiarization included fatigue-protocol pacing, standardized pre- and post-fatigue lifting trials, CMJ procedures, the motion-capture environment, and electrode placement. Following electrode placement and signal-quality verification, maximal voluntary isometric contractions (MVICs) were performed to normalize sEMG amplitude. For each muscle, two sets of five maximal attempts were conducted, with 2 min of recovery between sets. Standardized verbal encouragement was provided. The highest mean root mean square (RMS) amplitude obtained from a stable 500-ms window was used as the reference value corresponding to 100% MVIC.
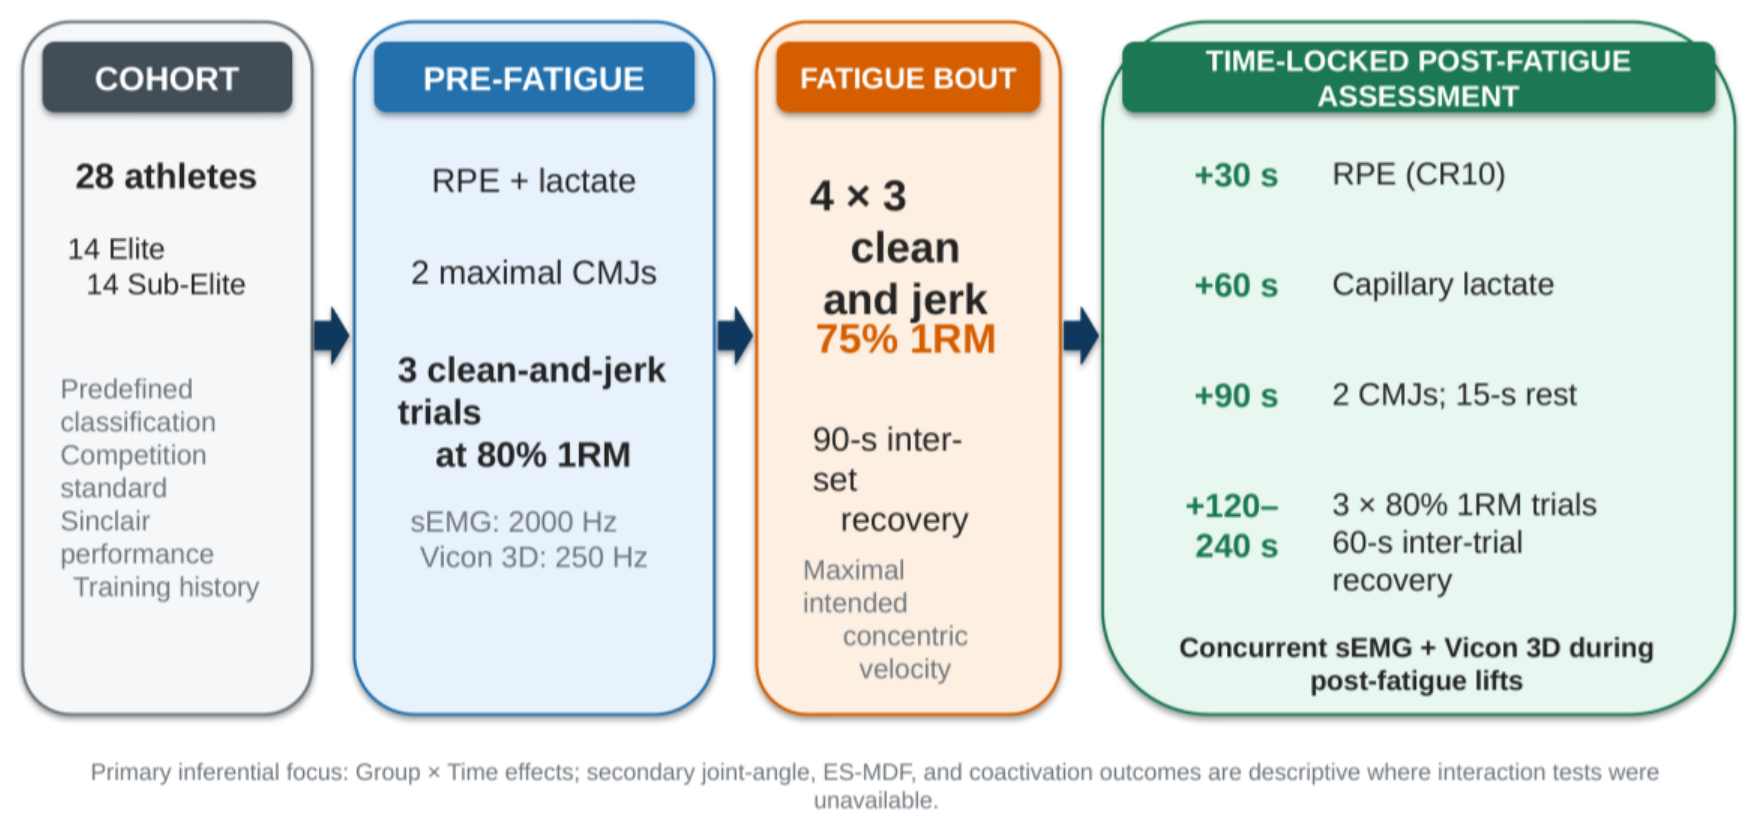
Muscle-specific testing positions were as follows: VL and RF, seated knee extension at approximately 60° of knee flexion; BF, prone knee flexion at approximately 45°; GM, prone hip extension with the knee flexed to approximately 90°; MG, standing isometric plantarflexion against fixed resistance; ES, prone isometric trunk extension in a modified Sorensen position; AD, seated shoulder flexion with the knee at approximately 90° of flexion; and UT, seated isometric shoulder elevation against fixed resistance. Rigid fixation or nonelastic straps were used where applicable to reduce examiner-dependent resistance. Following 10 min of seated rest, baseline RPE and capillary blood lactate concentration were recorded. Participants then completed baseline CMJ assessments and pre-fatigue clean-and-jerk trials. The fatigue protocol consisted of four sets of three clean-and-jerk repetitions at 75% of the verified 1RM, with 90 s of rest between sets. Participants were instructed to maintain technically correct lifting performance throughout the protocol. This standardized bout was selected to provide repeated exposure to relatively high external loads while remaining technically feasible across both competitive groups, consistent with previous research using Olympic-weightlifting movements and their derivatives to investigate acute fatigue responses (27). Post-fatigue assessments followed a predefined, time-locked sequence beginning immediately after the final repetition (Fig. 1). At 30 s, whole-body RPE was recorded using the CR10 scale (32). Capillary blood lactate was measured at 60 s. At 90 s, participants performed two maximal CMJs separated by 15 s, and the trial yielding the greater jump height was retained. Between 120 and 240 s, participants performed three single clean-and-jerk repetitions at 80% 1RM, with 60 s of recovery between trials. sEMG and three-dimensional kinematic data were recorded simultaneously. For each movement phase, data from the three valid trials were averaged within each condition to obtain neuromuscular and kinematic outcomes.
Surface Electromyography Processing
Raw sEMG signals were visually inspected, demeaned, and band-pass filtered between 20 and 450 Hz using a fourth-order zero-phase Butterworth filter. A 50-Hz notch filter was applied only when power-line interference was detected. Signal segments affected by clipping, sensor impacts, or nonphysiological artifacts were excluded. RMS amplitude was calculated using a 50-ms moving window and normalized to the corresponding MVIC value (%MVIC). Analysis windows were matched to movement phases using synchronized kinematic events to minimize potential bias arising from differences in contraction duration. Power spectral density was estimated within each analysis window, and median frequency (MDF) was defined as the frequency dividing the power spectrum into two regions of equal power. Rectus femoris MDF (RF-MDF) was designated as the primary spectral fatigue outcome, whereas erector spinae MDF (ES-MDF) was retained as an exploratory secondary measure. Rectus femoris–biceps femoris (RF–BF) coactivation was calculated from the overlap between normalized muscle activation profiles and expressed as a dimensionless index. Muscle activation onset was identified using a threshold referenced to resting signal noise and subsequently verified by visual inspection of the synchronized recordings. Onset-time variability was defined as the dispersion of event-referenced muscle activation onset times across the selected muscles. Interpretation of dynamic sEMG outcomes accounted for potential influences of muscle length, contraction velocity, and electrode movement on signal characteristics (20, 22–24).
Fig. 1. Experimental design and time-standardized post-fatigue assessment. RPE, rating of perceived exertion; CMJ, countermovement jump; sEMG, surface electromyography; 1RM, one-repetition maximum.
Kinematic Data Processing
Three-dimensional marker trajectories were reconstructed using Vicon Nexus software, version 2.14. Short gaps involving fewer than five consecutive frames were filled using spline interpolation only when the adjacent trajectory data supported reliable reconstruction. Marker coordinates were low-pass filtered using a fourth-order zero-phase Butterworth filter with an 8-Hz cutoff frequency selected through residual analysis. Vertical barbell velocity was calculated by numerical differentiation of the filtered vertical-position signal. The clean was divided into five phases: first pull, transition, second pull, turnover, and catch. The jerk was divided into four phases: dip, drive, turnover/flight, and recovery. Knee angle was defined as the sagittal-plane included angle between the thigh and shank, with approximately 180° representing full extension and smaller angles indicating greater flexion. Hip angle was defined using the corresponding sagittal pelvis–thigh convention, with values approaching 180° representing extension. Trunk inclination was measured relative to the global vertical axis, with 0° indicating an upright posture and positive values indicating forward inclination. Ankle angle was defined as the angle between the shank and foot, with approximately 90° representing the neutral position, values below 90° indicating dorsiflexion, and values above 90° indicating plantarflexion. Identical definitions and processing procedures were applied to pre- and post-fatigue trials.
Outcome Measures
The primary barbell-kinematic outcomes were peak vertical velocity during the clean, peak vertical velocity during the jerk, maximum barbell height during the clean, and anteroposterior horizontal barbell displacement relative to the starting position. Neuromuscular outcomes included RF-MDF and muscle activation onset-time variability. Physiological and performance-related outcomes included capillary blood lactate concentration, RPE, CMJ height, and CMJ peak power. Joint-kinematic variables included peak knee extension during the second pull of the clean, forward trunk inclination during the clean catch, knee angle during the jerk dip, and peak knee and hip angular velocities during the jerk drive. These variables were treated as exploratory mechanistic descriptors because complete Group × Time inferential results were unavailable for all outcomes. ES-MDF and RF–BF coactivation were also retained as exploratory descriptive measures.
Statistical Analysis
Continuous variables were summarized as means ± standard deviations (SD). Age and body mass were compared descriptively between groups, whereas sex distribution was summarized categorically. Training experience, clean-and-jerk 1RM, relative strength, Sinclair Total, and competition standard were treated as descriptors of the predefined competitive-level classifications rather than independent baseline outcomes. The primary inferential framework examined the effects of group (elite vs. sub-elite), time (pre- vs. post-fatigue), and the Group × Time interaction. To control the family-wise Type I error rate, the Holm procedure was applied within three prespecified outcome families: (a) fatigue verification and performance outcomes (blood lactate, RPE, CMJ height, and CMJ peak power); (b) neuromuscular interaction outcomes (RF-MDF and onset-time variability); and (c) barbell-kinematic outcomes (clean peak velocity, jerk peak velocity, maximum clean barbell height, and horizontal barbell displacement). Both unadjusted and Holm-adjusted p-values were reported, with adjusted values used for inferential interpretation. Where the original statistical output provided only p < 0.001, the adjusted threshold was reported conservatively according to the number of comparisons within the relevant outcome family (e.g., Holm-adjusted p < 0.002 or p < 0.004). Complete Group × Time inferential results were unavailable for joint-angle variables, ES-MDF, and RF–BF coactivation. Therefore, these outcomes were reported descriptively without within-group significance testing. No claims regarding competitive-level moderation were made for these variables. An exploratory pooled multiple linear regression analysis examined acute changes in peak vertical jerk velocity (post-fatigue minus pre-fatigue, m/s). Predictor variables were changes in RF-MDF (Hz), changes in knee angle during the jerk dip (degrees), changes in the RF–BF coactivation index, and competitive level (coded as 0 = elite and 1 = sub-elite). Regression coefficients, 95% confidence intervals, R², adjusted R², and variance inflation factors were reported. Previously considered group-stratified regression models were excluded because the subgroup sample size (n = 14) was insufficient for stable multivariable estimation. Statistical significance was set at p < 0.05, although the pooled regression was interpreted as exploratory and hypothesis-generating. All 28 participants completed the experimental protocol, and no missing performance data required imputation.
Results
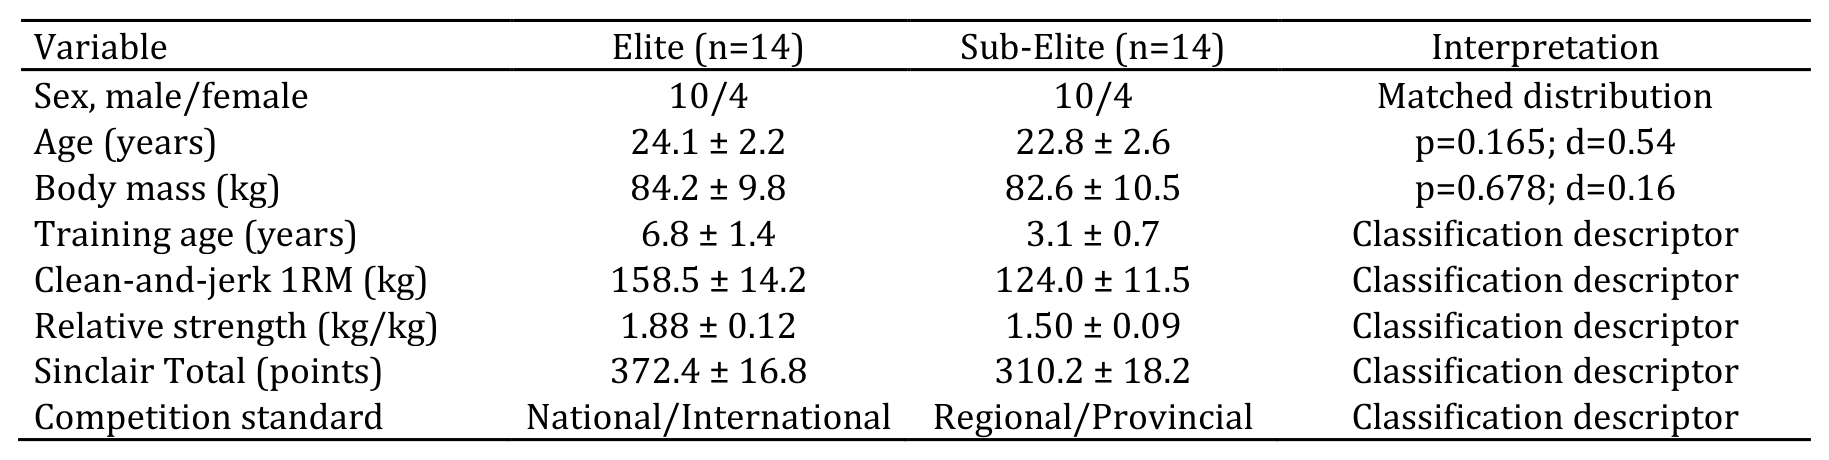
The final sample comprised 28 weightlifters, with 10 men and 4 women in each competitive group (elite and sub-elite). The identical sex distribution minimized differences in sex composition between groups; however, the study was neither designed nor powered to investigate sex-specific effects. Age and body mass did not differ significantly between groups. As expected from the predefined classification criteria, elite weightlifters had greater training experience, strength performance, Sinclair Totals, and competitive achievements. These characteristics were considered descriptors of competitive level rather than independent experimental findings (Table 1). All participants completed the experimental protocol, with no reported adverse events or missing performance data.
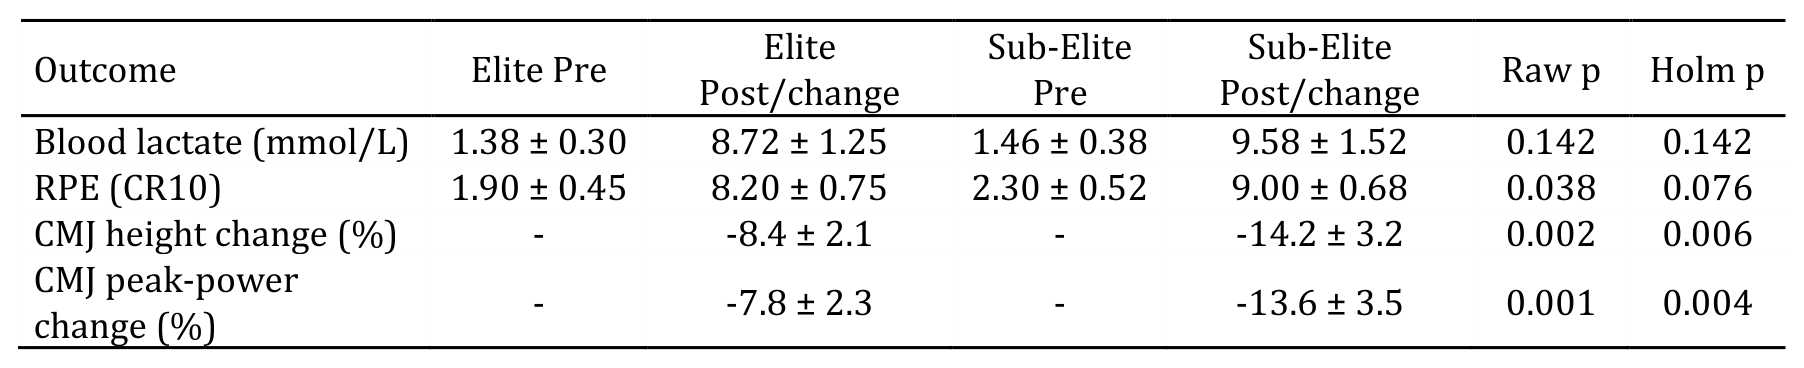
Capillary blood lactate concentration increased markedly following exercise in both groups, with no significant Group × Time interaction after Holm adjustment (Holm-adjusted p = 0.142). Similarly, the Group × Time interaction for ratings of perceived exertion (RPE) did not remain significant after correction for multiple comparisons (Holm-adjusted p = 0.076). In contrast, sub-elite weightlifters exhibited significantly greater reductions in countermovement jump (CMJ) height and peak power than elite weightlifters, with significant Group × Time interactions after Holm adjustment (Holm-adjusted p = 0.006 and p = 0.004, respectively; Table 2).
Table 1. Demographic, physical, and performance characteristics by competitive tier.
Note. Values are mean ± SD unless otherwise indicated. Training age, strength, Sinclair Total, and competition standard are components or expected correlates of the predefined tier classification and are not interpreted as independent experimental findings.
Table 2. Physiological and whole-body performance-fatigue responses.
Note. Raw p-values test Group × Time. Holm p-values are family-wise adjusted across lactate, RPE, CMJ height, and CMJ peak power. Adjusted p-values are used for inference.
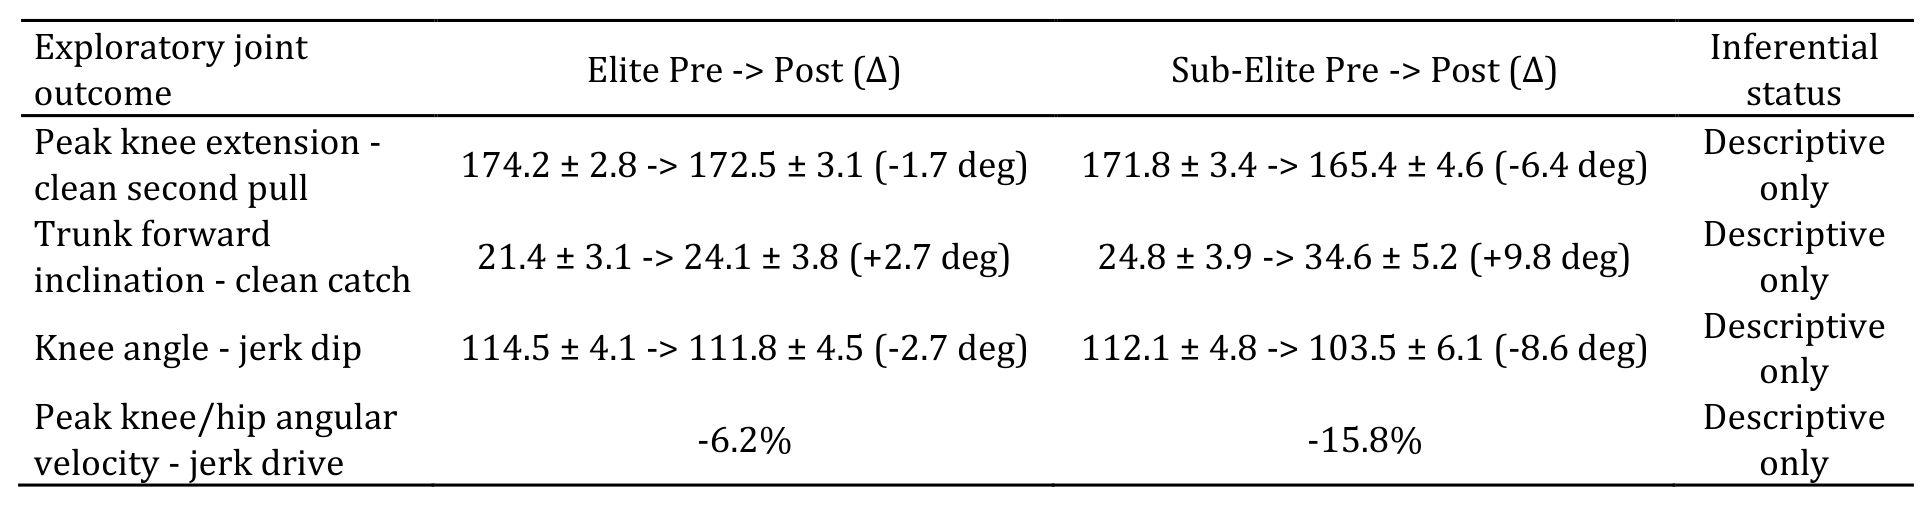
Descriptive analyses indicated greater fatigue-related changes in joint kinematics among sub-elite weightlifters. Peak knee extension during the second pull of the clean decreased by 1.7° in elite weightlifters and 6.4° in sub-elite weightlifters. Under the adopted joint-angle convention, approximately 180° represented full knee extension; therefore, smaller angles indicated reduced knee extension during the second pull. Forward trunk inclination during the clean catch increased by 2.7° and 9.8° in elite and sub-elite weightlifters, respectively. Trunk inclination was measured relative to the global vertical axis, with positive values indicating greater forward inclination. Knee angle during the jerk dip decreased by 2.7° in elite weightlifters and 8.6° in sub-elite weightlifters, indicating greater knee flexion during the dip phase. Peak knee and hip angular velocities during the jerk drive also decreased, with reported reductions of 6.2% and 15.8%, respectively (Table 3).
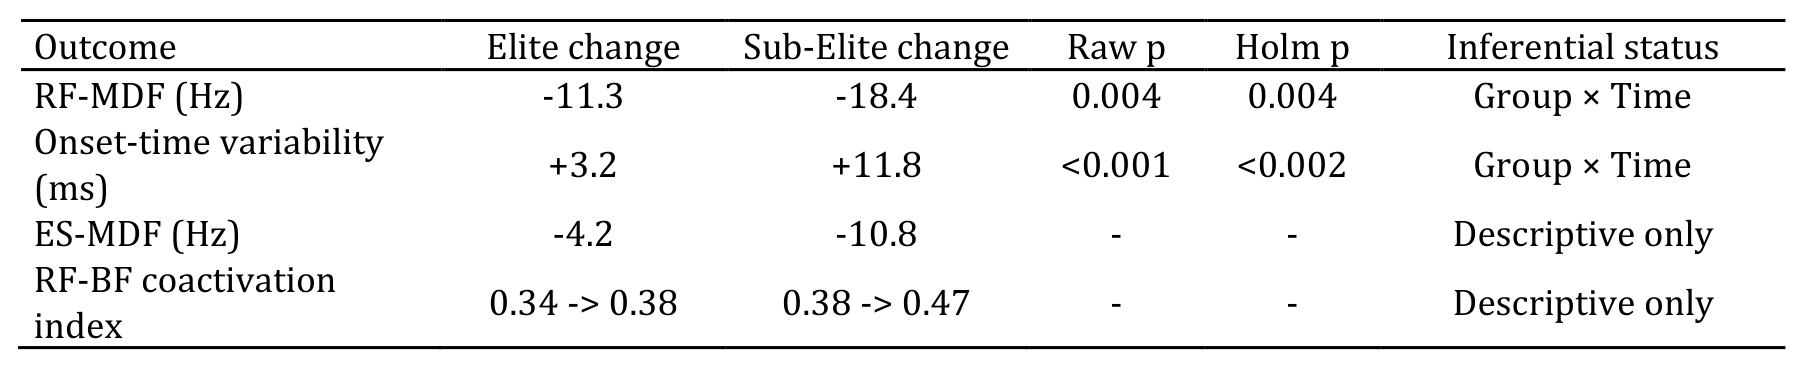
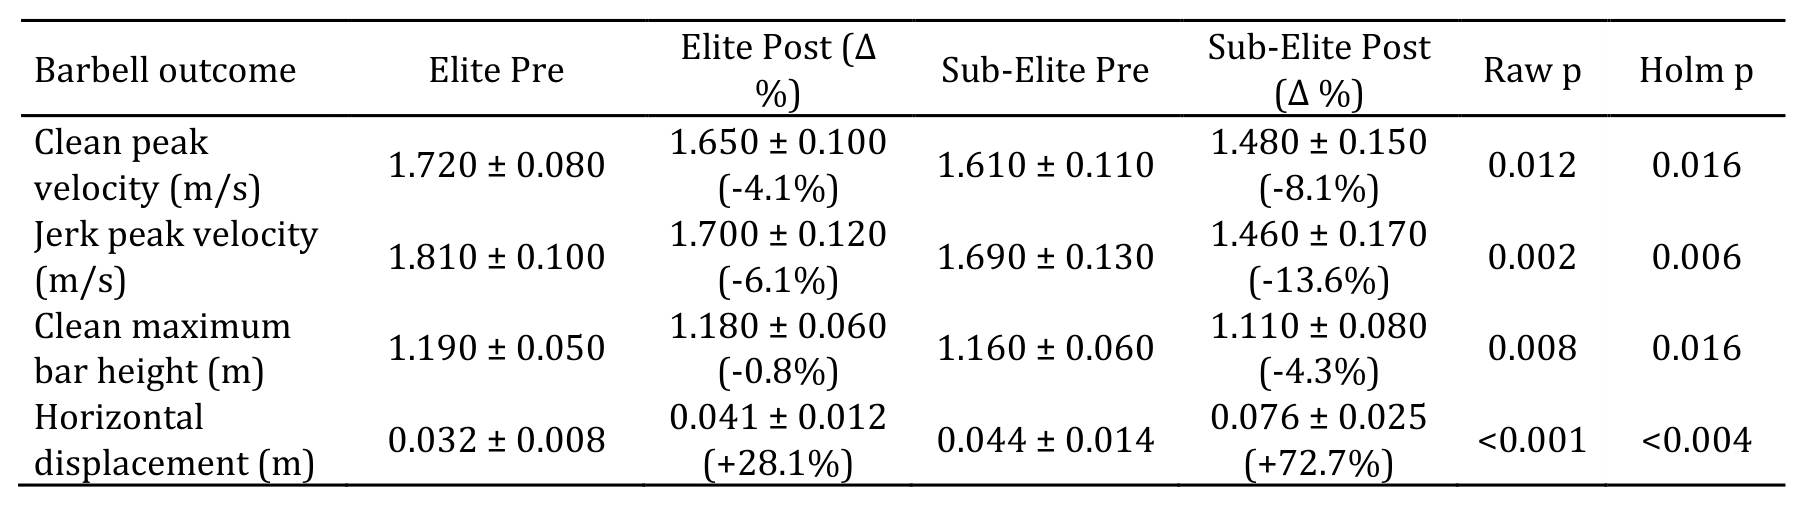
Rectus femoris median frequency (RF-MDF) decreased more markedly in sub-elite than elite weightlifters (−18.4 vs. −11.3 Hz), with a significant Group × Time interaction after Holm adjustment (Holm-adjusted p = 0.004). Muscle activation onset-time variability increased by 11.8 ms in sub-elite weightlifters compared with 3.2 ms in elite weightlifters, and the interaction remained significant after correction (Holm-adjusted p < 0.002). Erector spinae median frequency (ES-MDF) and rectus femoris–biceps femoris (RF–BF) coactivation exhibited numerically greater changes in sub-elite weightlifters. However, these findings were reported descriptively because complete Group × Time interaction analyses were unavailable (Table 4). All four barbell-kinematic outcomes demonstrated significant Group × Time interactions after Holm adjustment within the prespecified outcome family (Table 5). Peak vertical barbell velocity during the clean decreased by 4.1% in elite weightlifters and 8.1% in sub-elite weightlifters (Holm-adjusted p = 0.016). Peak vertical barbell velocity during the jerk decreased by 6.1% and 13.6%, respectively (Holm-adjusted p = 0.006). Maximum barbell height during the clean was largely maintained in elite weightlifters (−0.8%) but decreased by 4.3% in sub-elite weightlifters (Holm-adjusted p = 0.016). Horizontal barbell displacement increased by 28.1% in elite weightlifters and 72.7% in sub-elite weightlifters, with a significant Group × Time interaction (Holm-adjusted p < 0.004). The exploratory pooled multiple linear regression model, incorporating four predictors, was statistically significant (F(4, 23) = 10.321, p < 0.001) and explained 64.2% of the variance in acute changes in peak jerk velocity (R² = 0.642; adjusted R² = 0.580). Greater reductions in RF-MDF and knee angle during the jerk dip were associated with larger reductions in peak jerk velocity. Similarly, greater increases in RF–BF coactivation and sub-elite competitive status were associated with greater velocity losses (Table 6). Variance inflation factors were below 2.45, indicating no evidence of substantial multicollinearity based on this diagnostic. Nevertheless, given the relatively small sample size (N = 28) and the sensitivity analysis indicating adequate statistical power primarily for large multivariable effects, these findings should be interpreted as exploratory and require independent replication. No group-stratified regression analyses were retained.
Table 3. Exploratory joint-angle kinematics before and after fatigue.
Note. Lower knee-angle values indicate greater flexion. No Group × Time inference is claimed for these outcomes because complete interaction statistics were unavailable.
Table 4. Phase-matched neuromuscular fatigue and timing outcomes.
Note. MDF, median frequency; RF, rectus femoris; BF, biceps femoris; ES, erector spinae. Holm adjustment was applied to the two neuromuscular Group × Time tests. ES-MDF and coactivation are descriptive only.
Table 5. Barbell kinematics before and after acute fatigue.
Note. Holm p-values are family-wise adjusted across the four barbell-kinematic interaction tests. Positive horizontal-displacement change denotes greater bar-path excursion.
Table 6. Exploratory multiple regression predicting acute change in jerk peak vertical velocity.
Note. R²=0.642; adjusted R²=0.580; F(4,23)=10.321, p<0.001. Group coded 0=Elite and 1=Sub-Elite. Change=Post-Pre; more negative jerk-velocity change denotes greater loss. All VIF values were <2.45. The model is exploratory.
Discussion
The findings of the present study indicate that competitive level was associated with differences in the magnitude of acute fatigue-related changes in countermovement jump (CMJ) performance, rectus femoris median frequency (RF-MDF), muscle activation onset-time variability, and barbell mechanics during a standardized clean-and-jerk fatigue protocol. These conclusions are based on Group × Time interactions that remained significant after Holm correction for multiple comparisons. No between-group differences were inferred for joint-angle variables, erector spinae median frequency (ES-MDF), or muscle coactivation because complete interaction analyses were unavailable for these outcomes.
Both groups exhibited substantial increases in capillary blood lactate concentration following the fatigue protocol, with no significant Group × Time interaction. Thus, the observed between-group differences in performance deterioration were not accompanied by statistically detectable differences in lactate responses. Similarly, the Group × Time interaction for ratings of perceived exertion (RPE) did not remain significant after adjustment for multiple comparisons. A recent randomized study involving trained athletes demonstrated that resistance-training load and blood-flow restriction protocols can differentially affect strength, blood lactate concentration, and RPE, highlighting the importance of considering perceptual and metabolic responses alongside performance outcomes (33). In contrast, sub-elite weightlifters exhibited significantly greater reductions in CMJ height and peak power after Holm adjustment, indicating greater performance fatigability in this group. Although CMJ measures are widely used as practical indicators of neuromuscular status, they should be interpreted as global performance outcomes rather than direct indicators of a specific physiological fatigue mechanism (27, 31). The most consistent neuromuscular findings involved RF-MDF and muscle activation onset-time variability. The greater reduction in RF-MDF observed in sub-elite weightlifters is consistent with more pronounced fatigue-related changes in the spectral characteristics of rectus femoris activity under the standardized, phase-matched processing conditions used in this study (22–24). Similarly, the greater increase in onset-time variability suggests increased temporal dispersion in muscle activation patterns following fatigue. Previous studies have also reported fatigue-related alterations in lower-limb coordination and sport-specific movement organization (16, 17). However, these findings do not establish a causal relationship between localized muscle fatigue and deterioration in barbell mechanics, as neither mediation nor formal neuromuscular–mechanical coupling analyses were performed.
The joint-kinematic findings require cautious interpretation. Descriptive analyses indicated that sub-elite weightlifters exhibited greater reductions in knee extension during the second pull, increased forward trunk inclination during the clean catch, greater knee flexion during the jerk dip, and larger reductions in peak knee and hip angular velocities during the jerk drive. These patterns are biomechanically plausible and broadly consistent with previous research highlighting the contribution of hip and knee kinematics to weightlifting performance (6, 11, 12), as well as recent investigations of jerk and jerk-dip mechanics (7, 8). Nevertheless, complete Group × Time inferential analyses were unavailable for these secondary variables. Consequently, the observed numerical differences cannot be interpreted as statistically established differences in fatigue responses between competitive levels. The clearest evidence of competitive-level differences emerged from the barbell-kinematic outcomes. Sub-elite weightlifters exhibited approximately twice the percentage reduction in peak clean velocity compared with elite weightlifters, along with a greater reduction in peak jerk velocity, a larger decrease in maximum barbell height during the clean, and a more pronounced increase in horizontal barbell displacement. All four Group × Time interactions remained significant after Holm adjustment. These findings are consistent with previous research demonstrating that fatigue, set configuration, and exercise selection influence barbell velocity and related performance measures (25–27). They are also broadly aligned with studies examining the validity, reliability, and practical interpretation of barbell-velocity and trajectory measurements in weightlifting and resistance exercise (13, 15, 34–36). However, greater horizontal displacement should not automatically be interpreted as technical deterioration without considering movement direction, phase-specific requirements, and individual lifting strategies.
The pooled multivariable regression analysis was exploratory. Although the model explained a relatively large proportion of the observed variance in acute jerk-velocity changes, it included four predictors in a sample of only 28 athletes. The sensitivity analysis further indicated that the study was adequately powered primarily to detect large multivariable effects. Accordingly, the model should not be considered a validated predictive equation, and its individual coefficients should not be interpreted as evidence of causal neuromuscular–mechanical relationships. Instead, the findings identify a set of potentially relevant variables, including RF-MDF, jerk-dip knee angle, RF–BF coactivation, and competitive level, that warrant further investigation in larger independent samples. Group-specific multivariable regression models were not retained because the sample size of 14 participants per group was insufficient to support stable estimation of multiple regression coefficients. The operational definition of competitive level also warrants consideration. Participants were deliberately classified into elite and sub-elite groups using a composite of competitive achievement, Sinclair performance, and training history. Consequently, differences in training experience, 1RM performance, relative strength, and Sinclair Totals were expected characteristics of the predefined groups rather than outcomes attributable to the fatigue protocol. Competitive level should therefore be interpreted as a composite indicator of athletic expertise and performance status rather than a single independent exposure. Moreover, because these characteristics were incorporated into the classification criteria, their individual contributions to the observed fatigue responses cannot be isolated.
Several limitations should be acknowledged. First, the relatively small sample was drawn from a narrowly defined competitive population, and the sensitivity analysis indicated that the study was primarily capable of detecting large effects. Second, although both male and female weightlifters participated, the study was not designed or powered to examine sex-specific responses. Third, spectral measures derived from dynamic sEMG may be influenced by contraction velocity, muscle length, electrode movement, and other factors despite standardized sensor placement and phase-matched processing (22–24). Fourth, complete Group × Time interaction analyses were unavailable for several secondary joint-kinematic and neuromuscular variables, restricting their interpretation to descriptive comparisons. Fifth, the original protocol documentation did not retain sufficient detail regarding the exercise-specific content of the dynamic warm-up to permit reliable retrospective reporting. Sixth, although the post-fatigue assessment sequence was standardized, the intervals between RPE, lactate, CMJ, and lifting assessments allowed some physiological recovery to occur. Therefore, the observed responses represent different time points within the early post-exercise period rather than strictly simultaneous measures of fatigue. Finally, the exploratory regression model requires external validation before it can be used for prediction.
From a practical perspective, the most consistent competitive-level differences after correction for multiple comparisons were observed in peak clean and jerk velocity, horizontal barbell displacement, CMJ performance, RF-MDF, and muscle activation onset-time variability. Barbell-velocity measurements and video-based trajectory analysis may provide practical tools for monitoring fatigue-related changes in lifting performance, provided that the measurement systems demonstrate acceptable validity and reliability (13, 15, 34–36). Laboratory-based sEMG and three-dimensional motion analysis may offer additional information regarding neuromuscular and movement characteristics when available. Although changes in joint angles and muscle coactivation may be useful for individualized technical assessment, the present study did not establish statistically significant between-group differences in these secondary outcomes. Coaches should therefore interpret these measures as descriptive indicators of individual movement responses rather than validated diagnostic thresholds for fatigue or technical deterioration.
Conclusion
Acute fatigue induced by a standardized clean-and-jerk protocol was accompanied by substantial physiological responses in both competitive groups. However, sub-elite weightlifters exhibited significantly greater deterioration in countermovement jump (CMJ) performance, rectus femoris median frequency (RF-MDF), muscle activation onset-time variability, and barbell kinematics, as demonstrated by Group × Time interactions that remained significant after Holm adjustment. Compared with sub-elite weightlifters, elite weightlifters showed smaller reductions in peak clean and jerk velocities and maximum barbell height during the clean, along with a smaller increase in horizontal barbell displacement. Although secondary joint-kinematic, erector spinae median frequency (ES-MDF), and muscle coactivation measures showed descriptive patterns suggesting greater fatigue-related movement changes in sub-elite weightlifters, these differences were not confirmed by complete interaction analyses. Overall, the findings highlight the potential value of integrating neuromuscular and biomechanical assessments when monitoring fatigue-related changes in weightlifting performance. Larger studies are needed to confirm these findings and establish their practical applicability.
Ethical Considerations
Compliance with ethical guidelines
The study was approved by the Scientific Research Ethics Committee of the College of Physical Education and Sports Sciences, University of Samarra (Approval No. 32, dated 18 January 2026). Written informed consent was obtained from all participants before data collection. All procedures were conducted in accordance with the principles of the Declaration of Helsinki.
Funding
This research received no specific grant from any funding agency in the public, commercial, or not-for-profit sectors.
Authors' contributions
Saif Rasheed Ghanim: Conceptualization, Methodology, Investigation, Data Curation, Formal Analysis, Validation, Visualization, Writing – Original Draft, Writing – Review & Editing, Project Administration, and Supervision. The author read and approved the final version of the manuscript.
Conflicts of interest
The author declares no conflict of interest.
Data Availability Statement
The datasets generated and/or analyzed during the current study are available from the corresponding author upon reasonable request, subject to institutional and ethical requirements for participant confidentiality.
Use of Artificial Intelligence
OpenAI ChatGPT (GPT-5.6 Sol) was used solely for language editing. All scientific content, numerical values, statistical outputs, references, and final wording were reviewed and approved by the author.
h = v_takeoff² / (2g)
Type of Study: Research |
Subject:
General
Received: 2026/08/29 | Accepted: 2026/10/19 | Published: 2026/10/24
Received: 2026/08/29 | Accepted: 2026/10/19 | Published: 2026/10/24
References
1. Storey A, Smith HK. Unique aspects of competitive weightlifting: performance, training and physiology. Sports Medicine. 2012;42(9):769-790. [DOI:10.1007/BF03262294]
2. Stone MH, Pierce KC, Sands WA, Stone ME. Weightlifting: a brief overview. Strength and Conditioning Journal. 2006;28(1):50-66. [DOI:10.1519/1533-4295(2006)28[50:WABO]2.0.CO;2]
3. Garhammer J. Power production by Olympic weightlifters. Medicine & Science in Sports & Exercise. 1980;12(1):54-60. [DOI:10.1249/00005768-198021000-00011]
4. Garhammer J. Biomechanical profiles of Olympic weightlifters. International Journal of Sport Biomechanics. 1985;1(2):122-130. [DOI:10.1123/ijsb.1.2.122]
5. Gourgoulis V, Aggeloussis N, Mavromatis G, Garas A. Three-dimensional kinematic analysis of the snatch of elite Greek weightlifters. Journal of Sports Sciences. 2000;18(8):643-652. [DOI:10.1080/02640410050082332]
6. Kipp K, Redden J, Sabick MB, Harris C. Weightlifting performance is related to kinematic and kinetic patterns of the hip and knee joints. Journal of Strength and Conditioning Research. 2012;26(7):1838-1844. [DOI:10.1519/JSC.0b013e318239c1d2]
7. Liu G, He Z, Ye B, Guo H, Pan H, Zhu H, et al. Comparative analysis of the kinematic characteristics of lunge-style and squat-style jerk techniques in elite weightlifters. Life. 2024;14(9):1086. [DOI:10.3390/life14091086]
8. Ye B, Liu G, He Z, Xu J, Pan H, Zhu H. Biomechanical mechanisms of anterior cruciate ligament injury in the jerk dip phase of clean and jerk: a case study of an injury event captured on-site. Heliyon. 2024;10(11):e31390. [DOI:10.1016/j.heliyon.2024.e31390]
9. Soriano MA, Suchomel TJ, Comfort P. Weightlifting overhead pressing derivatives: a review of the literature. Sports Medicine. 2019;49(6):867-885. [DOI:10.1007/s40279-019-01096-8]
10. Suchomel TJ, Comfort P, Stone MH. Weightlifting pulling derivatives: rationale for implementation and application. Sports Medicine. 2015;45(6):823-839. [DOI:10.1007/s40279-015-0314-y]
11. Joffe SA, Chavda S, Gilham J, Sandercock GRH, Tallent J. A comparison of maximal isometric force in the first pull, transition and second pull of the clean and their contribution to predict performance in national and international level weightlifters. Sports Biomechanics. 2026;25(2):281-297. [DOI:10.1080/14763141.2025.2458478]
12. Arauz PG, Garcia G, Llerena J, Kao I. Biomechanical and neuromuscular differences between the snatch and clean in elite weightlifters. Journal of Biomechanics. 2026;195:113106. [DOI:10.1016/j.jbiomech.2025.113106]
13. Sandau I, Langen G, Nitzsche N. Variability of time series barbell kinematics in elite male weightlifters. Frontiers in Sports and Active Living. 2023;5:1264280. [DOI:10.3389/fspor.2023.1264280]
14. Kauhanen H, Hakkinen K, Komi PV. A biomechanical analysis of the snatch and clean and jerk techniques of Finnish elite and district level weightlifters. Scandinavian Journal of Sports Sciences. 1984;6(2):47-56.
15. Haj Lotfalian M. Validation of a low-cost inertial sensor for estimating barbell velocity during deadlift concentric phase. Journal of Sport Biomechanics. 2026;12(1):20-34. [DOI:10.61882/JSportBiomech.12.1.20]
16. Farrokhi Parashkoh M, Amirseyfaddini M, Naderi S. Effects of fatigue on lower-limb coordination and its variability during running in semi-professional soccer players. Journal of Sport Biomechanics. 2026;12(1):2-18. [DOI:10.61882/JSportBiomech.12.1.2]
17. Masoumi S. The interactive effect of pre-landing skill complexity and fatigue on biomechanical landing patterns in female taekwondo athletes. Journal of Sport Biomechanics. 2026;12(2):172-191. [DOI:10.66224/JSportBiomech.12.2.172]
18. Enoka RM, Duchateau J. Muscle fatigue: what, why and how it influences muscle function. The Journal of Physiology. 2008;586(1):11-23. [DOI:10.1113/jphysiol.2007.139477]
19. Hunter SK. Performance fatigability: mechanisms and task specificity. Cold Spring Harbor Perspectives in Medicine. 2018;8(7):a029728. [DOI:10.1101/cshperspect.a029728]
20. De Luca CJ. The use of surface electromyography in biomechanics. Journal of Applied Biomechanics. 1997;13(2):135-163. [DOI:10.1123/jab.13.2.135]
21. Hermens HJ, Freriks B, Disselhorst-Klug C, Rau G. Development of recommendations for SEMG sensors and sensor placement procedures. Journal of Electromyography and Kinesiology. 2000;10(5):361-374. [DOI:10.1016/S1050-6411(00)00027-4]
22. Farina D, Merletti R, Enoka RM. The extraction of neural strategies from the surface EMG. Journal of Applied Physiology. 2004;96(4):1486-1495. [DOI:10.1152/japplphysiol.01070.2003]
23. Farina D. Interpretation of the surface electromyogram in dynamic contractions. Exercise and Sport Sciences Reviews. 2006;34(3):121-127. [DOI:10.1249/00003677-200607000-00006]
24. Sun J, Liu Y, Yan S, et al. Application of surface electromyography in exercise fatigue: a review. Frontiers in Systems Neuroscience. 2022;16:893275. [DOI:10.3389/fnsys.2022.893275]
25. Hardee JP, Lawrence MM, Zwetsloot KA, Triplett NT, Utter AC, McBride JM. Effect of cluster set configurations on power clean technique. Journal of Sports Sciences. 2013;31(5):488-496. [DOI:10.1080/02640414.2012.736633]
26. Hardee JP, Lawrence MM, Utter AC, Triplett NT, Zwetsloot KA, McBride JM. Effect of inter-repetition rest on ratings of perceived exertion during multiple sets of the power clean. European Journal of Applied Physiology. 2012;112(8):3141-3147. [DOI:10.1007/s00421-011-2300-x]
27. Antunes JP, Oliveira R, Reis VM, Romero F, Moutao J, Brito JP. Comparison between Olympic weightlifting lifts and derivatives for external load and fatigue monitoring. Healthcare. 2022;10(12):2499. [DOI:10.3390/healthcare10122499]
28. Faul F, Erdfelder E, Buchner A, Lang AG. Statistical power analyses using G*Power 3.1: tests for correlation and regression analyses. Behavior Research Methods. 2009;41(4):1149-1160. [DOI:10.3758/BRM.41.4.1149]
29. van Melick N, Meddeler BM, Hoogeboom TJ, Nijhuis-van der Sanden MWG, van Cingel REH. How to determine leg dominance: the agreement between self-reported and observed performance in healthy adults. PLOS ONE. 2017;12(12):e0189876. [DOI:10.1371/journal.pone.0189876]
30. Raa A, Sunde GA, Bolann B, Kvale R, Bjerkvig C, Eliassen HS, et al. Validation of a point-of-care capillary lactate measuring device (Lactate Pro 2). Scandinavian Journal of Trauma, Resuscitation and Emergency Medicine. 2020;28(1):83. [DOI:10.1186/s13049-020-00776-z]
31. Linthorne NP. Analysis of standing vertical jumps using a force platform. American Journal of Physics. 2001;69(11):1198-1204. [DOI:10.1119/1.1397460]
32. Borg G. Borg's Perceived Exertion and Pain Scales. Champaign, IL: Human Kinetics; 1998.
33. Ghanim SR, Mahmood IS, Mohammed SA, Ahmed MK. Comparative study of high- and low-load blood flow restriction training on strength, hypertrophy, aerobic capacity, and fatigue in athletes. Comparative Exercise Physiology. 2025;22(1):15-22. [DOI:10.1163/17552559-bja10070]
34. Martinez-Cava A, Hernandez-Belmonte A, Courel-Ibanez J, Moran-Navarro R, Gonzalez-Badillo JJ, Pallares JG. Reliability of technologies to measure the barbell velocity: implications for monitoring resistance training. PLOS ONE. 2020;15(6):e0232465. [DOI:10.1371/journal.pone.0232465]
35. Weakley J, Mann B, Banyard H, McLaren S, Scott T, Garcia-Ramos A. Velocity-based training: from theory to application. Strength and Conditioning Journal. 2021;43(2):31-49. [DOI:10.1519/SSC.0000000000000560]
36. Gonzalez-Badillo JJ, Yanez-Garcia JM, Mora-Custodio R, Rodriguez-Rosell D. Velocity loss as a variable for monitoring resistance exercise. International Journal of Sports Medicine. 2017;38(3):217-225. [DOI:10.1055/s-0042-120324]
| Rights and permissions | |
 |
This work is licensed under a Creative Commons Attribution-NonCommercial 4.0 International License. |

Journal of Sport Biomechanics
Department of Sport Biomechanics, Faculty of Humanities, Islamic Azad University, Hamedan Branch, Prof. Mousivand Blvd, Imam Khomeini Blvd, Hamedan, Iran.
Journal Tel: +98 81 34494042
Website: http://biomechanics.iauh.ac.ir
Email: sportbiomechanics@iauh.ac.ir
