

Volume 12, Issue 2 (9-2026)
J Sport Biomech 2026, 12(2): 154-170 |
Back to browse issues page


![]()
![]()
![]()
Download citation:
BibTeX | RIS | EndNote | Medlars | ProCite | Reference Manager | RefWorks
Send citation to:


BibTeX | RIS | EndNote | Medlars | ProCite | Reference Manager | RefWorks
Send citation to:
Gazi M A, Roy S, Islam M A, Abdullah M, Mahara A, Rahaman A et al . Age-Related Anthropometric Changes in Schoolboys Aged 12 to 14. J Sport Biomech 2026; 12 (2) :154-170
URL: http://biomechanics.iauh.ac.ir/article-1-442-en.html
URL: http://biomechanics.iauh.ac.ir/article-1-442-en.html
Md. Arman Gazi1 

 , Suvo Roy1 , Md. Azadul Islam2 , Md. Abdullah1 , Asit Mahara3 , Aminur Rahaman4 , Md. Rayhan Rakib *5
, Suvo Roy1 , Md. Azadul Islam2 , Md. Abdullah1 , Asit Mahara3 , Aminur Rahaman4 , Md. Rayhan Rakib *5
1- Department of Physical Education and Sports Science, Jashore University of Science and Technology, Jashore, Bangladesh.
2- School of Physical Education and Health Engineering, Taiyuan University of Technology, Taiyuan, Shanxi Province, China.
3- Department of Physical Education and Sport Science, Panskura Banamali College, Vidyasagar University, Panskura, West Bengal, India.
4- Department of Physical Education and Sports Sciences, University of Delhi, Delhi, India.
5- Office of the Physical Education, Jashore University of Science and Technology, Jashore, Bangladesh.
Full-Text [PDF 1728 kb]
(427 Downloads)
| Abstract (HTML) (904 Views)

Full-Text: (341 Views)
1. Introduction
The growth and development of children and adolescents are influenced by social, nutritional, and environmental factors within the home, school, and community. During this stage, individuals experience significant changes in body composition alongside increases in overall body size (1). Child development is a crucial indicator of population health and the effectiveness of intervention programs, underscoring the importance of children as key members of society (2). According to the World Health Organization, more than 390 million children and adolescents were overweight in 2022, including 160 million who were classified as obese (3). These alarming statistics highlight the need to assess children's nutritional status, which is commonly evaluated using the Body Mass Index (BMI). However, BMI alone may be misleading; a more accurate assessment requires the calculation of BMI-for-age Z-scores, which adjust for age and sex (4, 5). These age- and sex-specific reference standards are recommended by both the WHO and national guidelines (6).
Monitoring children’s physical development is essential, and anthropometric measurements are among the most practical and effective tools available for this purpose (7). Changes in anthropometric characteristics—such as height, weight, and body proportions—provide clear indicators of growth and maturation (8, 9). Although advanced technologies exist for assessing body composition, simple anthropometric methods are often preferred due to their accessibility, cost-effectiveness, and reliability (10). Anthropometric data offer valuable insight into children’s overall health, nutritional status, and growth trajectory (11, 12). Various techniques are used to collect these data, with manual measurement tools such as measuring tapes, anthropometers, and calipers remaining widely applied (13). Anthropometry involves measuring parameters such as skinfold thickness, circumferences, and lengths to quantify body size, shape, and structure (11), offering a non-invasive and practical means of evaluating nutritional and health status (14, 15).
Height and BMI are key anthropometric indicators that reflect nutritional quality and environmental conditions during childhood and adolescence. These factors significantly influence long-term health outcomes and developmental potential (16). A low BMI, often indicative of undernutrition, is associated with impaired cognitive function, increased risk of disease, higher mortality, and reduced academic and economic productivity (17). Conversely, a high BMI is linked to early-onset disability and increased adult mortality (18). Although BMI is widely used in epidemiological research to estimate mortality risk (19), other measures—such as triceps skinfold thickness—provide more accurate information on peripheral fat distribution (20). Skinfold measurements are particularly effective for estimating body fat percentage and detecting deviations from healthy fat levels in children (21). Studies have shown that skinfold thickness correlates more strongly with fat mass than BMI does (22), making it a preferred indicator for evaluating subcutaneous fat and related health risks (23, 24). Childhood obesity is an emerging public health concern in Bangladesh and is associated with increased risks of diabetes, cardiovascular disease, and cancer (25). While BMI is commonly used to assess growth, it does not reliably represent fat distribution. Skinfold thickness offers a more accurate and cost-effective method for estimating body composition and identifying early health risks. Despite extensive global research on age-related body composition, current population-specific data for Bangladeshi schoolboys remain limited. Local anthropometric data are essential because growth patterns and body composition vary with genetic, environmental, and lifestyle factors. This study addresses this gap by assessing the growth status of schoolboys aged 12 to 14 years in Jashore, Bangladesh.
Three skinfold sites—triceps, subscapular, and suprailiac—were selected to represent both peripheral and central fat deposits. Although the standard seven-site protocol is more comprehensive, the three-site method is validated, practical, and feasible in school-based assessments.
The present study aims to evaluate growth status using anthropometric indicators among schoolboys aged 12–14 years. It is hypothesized that height, weight, and BMI will progressively increase with age; that skinfold thickness, fat percentage, and fat mass will rise with age; that lean body mass will exhibit greater increases in later adolescence; and that body composition measures will differ significantly across age groups, highlighting the need for local anthropometric reference data to guide health interventions.
2. Methods
2.1 Subjects
A total of 90 schoolboys aged 12 to 14 years participated in this study. The subjects were evenly distributed across three age groups (n = 30 for each): 12, 13, and 14 years. All participants were recruited from secondary schools in the Jashore district of Bangladesh. Written informed consent was obtained from all participants and/or their guardians prior to data collection. Only healthy boys without chronic illnesses, physical disabilities, or regular involvement in competitive sports were included. Individuals with medical conditions or recent injuries were excluded. The sample size was determined using G*Power software, with a significance level of 0.05, a power of 80%, and an effect size derived from previous studies. Participants were selected using simple random sampling to ensure balanced representation across the age groups.
2.2 Criterion Measures
This study utilized several anthropometric measurements—including triceps, subscapular, and suprailiac skinfolds, fat percentage, fat mass, and lean body mass—as the primary criterion measures. BMI, used to assess weight relative to height, was calculated from measured body weight and height. Weight was measured using a digital scale (OMRON, India) with an accuracy of 0.1 kg, while height was measured using a stadiometer (KRUPS, India) to the nearest 0.1 cm (26). Skinfold thickness was measured at three anatomical sites: triceps, subscapular, and suprailiac. All measurements were taken on the right side of the body using a calibrated skinfold caliper (e.g., Harpenden Skinfold Caliper, Model 68875, Baty International, UK) with a precision of 0.2 mm. Each site was measured twice; if the two readings differed by more than 1 mm, a third measurement was taken. The two closest values were averaged for analysis. All procedures adhered to the standard operating guidelines of the International Society for the Advancement of Kinanthropometry (ISAK) (27).
2.3 Test Procedures
The triceps skinfold was measured midway between the acromion and olecranon processes on the posterior aspect of the upper arm. Participants stood in a relaxed posture with their arms hanging naturally. The skinfold was gently lifted, and the measurement was recorded in millimeters (28). The subscapular skinfold was measured at the inferior angle of the right scapula. The angle was palpated and marked with a cosmetic pencil. The skinfold was raised adjacent to this landmark in an oblique direction (downward and outward at approximately 45 degrees), and the measurement was recorded in millimeters (29, 30). The suprailiac skinfold was measured at the intersection of a line joining the anterior superior iliac spine and the anterior axillary line, along a horizontal level with the iliac crest. Approximately 5–7 cm above the anterior superior iliac spine, the skinfold was raised in a downward and inward direction at about 45 degrees. Measurements were taken while participants stood in a relaxed position and recorded in millimeters (28, 31).
Body composition variables—including body fat percentage, fat mass, and lean body mass—were derived from the skinfold data. The sum of the triceps and subscapular skinfolds was used to estimate body fat percentage using the age- and sex-specific equations developed by Slaughter et al. (1988), which are widely validated for children and adolescents.
For boys:
• If triceps + subscapular ≤ 35 mm:
Body fat (%) = 1.21 × (sum) − 0.008 × (sum)² − 1.7
• If triceps + subscapular > 35 mm:
Body fat (%) = 0.783 × (sum) + 1.6
Fat mass (FM) was calculated as:
FM (kg) = (body fat percentage ÷ 100) × body weight
Lean body mass (LBM) was calculated as:
LBM (kg) = body weight − fat mass (32)
2.4 Statistical Analysis
All statistical analyses were performed using IBM SPSS Statistics (Version 25). Descriptive statistics—means, standard deviations, and standard errors of the mean—were computed for each age group. A one-way analysis of variance (ANOVA) was used to identify significant differences among groups, followed by Tukey’s HSD post hoc test for pairwise comparisons. Levene’s test was used to confirm homogeneity of variances, and the Shapiro–Wilk test verified the normality of data distribution. A significance level of p < 0.05 was applied for all analyses.
3. Results
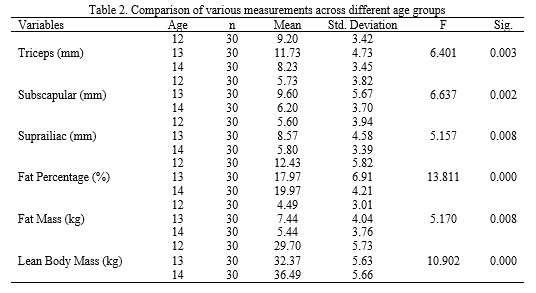
The following Table 1 presents the general characteristics of the subjects, demonstrating that height and weight progressively increase with age. Table 2 summarizes the analysis of body composition across the age groups. Significant differences were observed in skinfold thickness (triceps, subscapular, and suprailiac), fat percentage, fat mass, and lean body mass, indicating that body composition varies substantially with age.
The growth and development of children and adolescents are influenced by social, nutritional, and environmental factors within the home, school, and community. During this stage, individuals experience significant changes in body composition alongside increases in overall body size (1). Child development is a crucial indicator of population health and the effectiveness of intervention programs, underscoring the importance of children as key members of society (2). According to the World Health Organization, more than 390 million children and adolescents were overweight in 2022, including 160 million who were classified as obese (3). These alarming statistics highlight the need to assess children's nutritional status, which is commonly evaluated using the Body Mass Index (BMI). However, BMI alone may be misleading; a more accurate assessment requires the calculation of BMI-for-age Z-scores, which adjust for age and sex (4, 5). These age- and sex-specific reference standards are recommended by both the WHO and national guidelines (6).
Monitoring children’s physical development is essential, and anthropometric measurements are among the most practical and effective tools available for this purpose (7). Changes in anthropometric characteristics—such as height, weight, and body proportions—provide clear indicators of growth and maturation (8, 9). Although advanced technologies exist for assessing body composition, simple anthropometric methods are often preferred due to their accessibility, cost-effectiveness, and reliability (10). Anthropometric data offer valuable insight into children’s overall health, nutritional status, and growth trajectory (11, 12). Various techniques are used to collect these data, with manual measurement tools such as measuring tapes, anthropometers, and calipers remaining widely applied (13). Anthropometry involves measuring parameters such as skinfold thickness, circumferences, and lengths to quantify body size, shape, and structure (11), offering a non-invasive and practical means of evaluating nutritional and health status (14, 15).
Height and BMI are key anthropometric indicators that reflect nutritional quality and environmental conditions during childhood and adolescence. These factors significantly influence long-term health outcomes and developmental potential (16). A low BMI, often indicative of undernutrition, is associated with impaired cognitive function, increased risk of disease, higher mortality, and reduced academic and economic productivity (17). Conversely, a high BMI is linked to early-onset disability and increased adult mortality (18). Although BMI is widely used in epidemiological research to estimate mortality risk (19), other measures—such as triceps skinfold thickness—provide more accurate information on peripheral fat distribution (20). Skinfold measurements are particularly effective for estimating body fat percentage and detecting deviations from healthy fat levels in children (21). Studies have shown that skinfold thickness correlates more strongly with fat mass than BMI does (22), making it a preferred indicator for evaluating subcutaneous fat and related health risks (23, 24). Childhood obesity is an emerging public health concern in Bangladesh and is associated with increased risks of diabetes, cardiovascular disease, and cancer (25). While BMI is commonly used to assess growth, it does not reliably represent fat distribution. Skinfold thickness offers a more accurate and cost-effective method for estimating body composition and identifying early health risks. Despite extensive global research on age-related body composition, current population-specific data for Bangladeshi schoolboys remain limited. Local anthropometric data are essential because growth patterns and body composition vary with genetic, environmental, and lifestyle factors. This study addresses this gap by assessing the growth status of schoolboys aged 12 to 14 years in Jashore, Bangladesh.
Three skinfold sites—triceps, subscapular, and suprailiac—were selected to represent both peripheral and central fat deposits. Although the standard seven-site protocol is more comprehensive, the three-site method is validated, practical, and feasible in school-based assessments.
The present study aims to evaluate growth status using anthropometric indicators among schoolboys aged 12–14 years. It is hypothesized that height, weight, and BMI will progressively increase with age; that skinfold thickness, fat percentage, and fat mass will rise with age; that lean body mass will exhibit greater increases in later adolescence; and that body composition measures will differ significantly across age groups, highlighting the need for local anthropometric reference data to guide health interventions.
2. Methods
2.1 Subjects
A total of 90 schoolboys aged 12 to 14 years participated in this study. The subjects were evenly distributed across three age groups (n = 30 for each): 12, 13, and 14 years. All participants were recruited from secondary schools in the Jashore district of Bangladesh. Written informed consent was obtained from all participants and/or their guardians prior to data collection. Only healthy boys without chronic illnesses, physical disabilities, or regular involvement in competitive sports were included. Individuals with medical conditions or recent injuries were excluded. The sample size was determined using G*Power software, with a significance level of 0.05, a power of 80%, and an effect size derived from previous studies. Participants were selected using simple random sampling to ensure balanced representation across the age groups.
2.2 Criterion Measures
This study utilized several anthropometric measurements—including triceps, subscapular, and suprailiac skinfolds, fat percentage, fat mass, and lean body mass—as the primary criterion measures. BMI, used to assess weight relative to height, was calculated from measured body weight and height. Weight was measured using a digital scale (OMRON, India) with an accuracy of 0.1 kg, while height was measured using a stadiometer (KRUPS, India) to the nearest 0.1 cm (26). Skinfold thickness was measured at three anatomical sites: triceps, subscapular, and suprailiac. All measurements were taken on the right side of the body using a calibrated skinfold caliper (e.g., Harpenden Skinfold Caliper, Model 68875, Baty International, UK) with a precision of 0.2 mm. Each site was measured twice; if the two readings differed by more than 1 mm, a third measurement was taken. The two closest values were averaged for analysis. All procedures adhered to the standard operating guidelines of the International Society for the Advancement of Kinanthropometry (ISAK) (27).
2.3 Test Procedures
The triceps skinfold was measured midway between the acromion and olecranon processes on the posterior aspect of the upper arm. Participants stood in a relaxed posture with their arms hanging naturally. The skinfold was gently lifted, and the measurement was recorded in millimeters (28). The subscapular skinfold was measured at the inferior angle of the right scapula. The angle was palpated and marked with a cosmetic pencil. The skinfold was raised adjacent to this landmark in an oblique direction (downward and outward at approximately 45 degrees), and the measurement was recorded in millimeters (29, 30). The suprailiac skinfold was measured at the intersection of a line joining the anterior superior iliac spine and the anterior axillary line, along a horizontal level with the iliac crest. Approximately 5–7 cm above the anterior superior iliac spine, the skinfold was raised in a downward and inward direction at about 45 degrees. Measurements were taken while participants stood in a relaxed position and recorded in millimeters (28, 31).
Body composition variables—including body fat percentage, fat mass, and lean body mass—were derived from the skinfold data. The sum of the triceps and subscapular skinfolds was used to estimate body fat percentage using the age- and sex-specific equations developed by Slaughter et al. (1988), which are widely validated for children and adolescents.
For boys:
• If triceps + subscapular ≤ 35 mm:
Body fat (%) = 1.21 × (sum) − 0.008 × (sum)² − 1.7
• If triceps + subscapular > 35 mm:
Body fat (%) = 0.783 × (sum) + 1.6
Fat mass (FM) was calculated as:
FM (kg) = (body fat percentage ÷ 100) × body weight
Lean body mass (LBM) was calculated as:
LBM (kg) = body weight − fat mass (32)
2.4 Statistical Analysis
All statistical analyses were performed using IBM SPSS Statistics (Version 25). Descriptive statistics—means, standard deviations, and standard errors of the mean—were computed for each age group. A one-way analysis of variance (ANOVA) was used to identify significant differences among groups, followed by Tukey’s HSD post hoc test for pairwise comparisons. Levene’s test was used to confirm homogeneity of variances, and the Shapiro–Wilk test verified the normality of data distribution. A significance level of p < 0.05 was applied for all analyses.
3. Results
The following Table 1 presents the general characteristics of the subjects, demonstrating that height and weight progressively increase with age. Table 2 summarizes the analysis of body composition across the age groups. Significant differences were observed in skinfold thickness (triceps, subscapular, and suprailiac), fat percentage, fat mass, and lean body mass, indicating that body composition varies substantially with age.
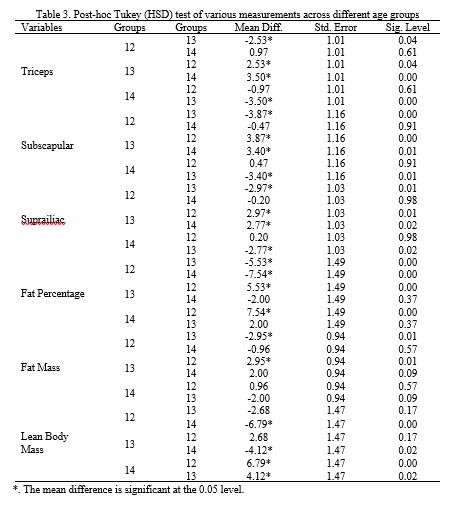
A series of post-hoc Tukey comparisons further confirmed significant differences in body composition among the 12-, 13-, and 14-year-old groups. These results show that skinfold thickness, fat percentage, fat mass, and lean body mass generally increase with advancing age (Table 3).
4. Discussion
The results of this study demonstrate clear age-related patterns in growth and body composition during early adolescence. As expected, increases in height and weight across age groups reflect normal physical development. The notable rise in skinfold thicknesses and fat mass between ages 12 and 13 suggests early fat accumulation, which then stabilizes by age 14. At the same time, lean body mass continues to increase markedly—particularly between ages 13 and 14—indicating a developmental shift toward greater muscle growth in later adolescence. This trajectory aligns with typical pubertal maturation, during which initial gains in adiposity are followed by substantial accretion of lean tissue. Collectively, these findings highlight the dynamic nature of adolescent growth and emphasize the importance of age-specific reference values when assessing health and developmental status in this population. Consistent with expectations, the adolescent participants exhibited progressive increases in height and weight, in line with established patterns of somatic growth during early adolescence (33, 34).
These changes reflect the onset of puberty, a period characterized by hormonally driven acceleration in muscle and bone development (35, 36). Notably, BMI did not differ significantly across groups, indicating that increases in weight were proportionate to increases in height—a pattern that mirrors previous findings on adolescent growth (37, 38). Significant variations were observed, however, in triceps, subscapular, and suprailiac skinfold thicknesses, as well as in fat percentage, fat mass, and lean body mass. These results reinforce the understanding that adolescence involves not only linear growth but also substantial shifts in body composition (32). The elevated skinfold thickness and fat percentage observed at age 13, followed by further increases in lean body mass at age 14, support current developmental models that describe fat deposition preceding muscle hypertrophy during puberty (39, 40). This pattern is particularly relevant considering that peak adiposity typically occurs early in puberty, after which fat levels decline and muscle mass increases—especially in males (41, 42). A comprehensive understanding of adolescent development requires consideration of hormonal influences, body composition changes, and lifestyle factors. Rising hormone levels enhance protein metabolism, contributing to increased muscle mass during this stage (43, 44). The minimal variation in BMI across groups further supports critiques of BMI as a sole indicator of body composition, as it does not distinguish between fat mass and fat-free mass (45, 46). The current findings underscore the need for more specific measures—such as skinfold thickness and body fat percentage—to accurately monitor developmental changes. Moreover, activity level plays a key role in shaping body composition; physically active adolescents typically have lower fat mass and higher lean body mass compared to their inactive peers (47). Anthropometric measures can therefore be useful tools for identifying youths with athletic potential (48). Routine screening, early detection of abnormalities, and targeted corrective interventions are essential for preventing injuries, maintaining health, and optimizing performance in competitive sports (49).
In summary, these findings highlight the importance of individualized and multidimensional assessment approaches when evaluating adolescent development. Such strategies can guide targeted interventions that promote healthy growth. Future research should incorporate sex-based comparisons, pubertal staging, nutritional assessment, and physical activity measures to provide a more comprehensive understanding of physiological changes during adolescence. Despite the value of the present findings, several limitations should be acknowledged. The relatively small sample size may limit the generalizability of the results. Additionally, only three skinfold sites were measured; using seven or more sites would provide a more complete assessment of body composition. The absence of Tanner staging restricts interpretation of variation associated with pubertal development. Furthermore, physical activity levels and nutritional status were not assessed, although both factors can strongly influence body composition. A potential clustering effect based on school characteristics may also have influenced the findings. Future studies should include larger and more diverse samples, incorporate pubertal assessment, and evaluate physical activity and dietary intake. Despite its limitations, this study provides valuable preliminary data on height, BMI, body fat percentage, and other anthropometric characteristics among school-aged boys, offering a foundation for subsequent research in this area. By measuring triceps, subscapular, and suprailiac skinfolds to estimate body fat percentage, fat mass, and lean body mass, this work offers practical insights for parents, coaches, and educators. These findings may support a better understanding of children’s growth patterns and assist school sports instructors in identifying and selecting potential young athletes more effectively.
5. Conclusion
The results showed significant age-group differences in body composition among schoolboys aged 12 to 14 years in Jashore, Bangladesh. Triceps, subscapular, and suprailiac skinfold thicknesses, as well as fat mass, peaked at age 13, whereas body fat percentage was highest at age 14. Lean body mass was also significantly higher at age 14 compared to both younger groups. These findings reflect measurable differences in body composition across age groups rather than developmental progression. The study underscores the value of routine anthropometric assessments to support age-appropriate health and nutrition strategies in school settings.
Ethical Considerations
Compliance with ethical guidelines
The study was reviewed and approved by the Departmental Examination Committee of the Department of Physical Education and Sports Science at Jashore University of Science and Technology, Jashore-7408, Bangladesh.
Funding
This research did not receive any financial support from government, private, or non-profit organizations.
Authors' contributions
All authors contributed equally to preparing the article.
Conflicts of interest
The authors declare that they have no conflict of interest associated with this study.
Type of Study: Research |
Subject:
General
Received: 2025/09/23 | Accepted: 2025/11/20 | Published: 2025/11/22
Received: 2025/09/23 | Accepted: 2025/11/20 | Published: 2025/11/22
References
1. NCD Risk Factor Collaboration (NCD-RisC). Height and body-mass index trajectories of school-aged children and adolescents from 1985 to 2019 in 200 countries and territories: A pooled analysis of 2181 population-based studies with 65 million participants. The Lancet. 2020;396(10261):1511-24. [DOI:10.1530/ey.18.13.15]
2. Wilson AL, Jovanovic JM, Harman-Smith YE, Ward PR. A population health approach in education to support children's early development: A critical interpretive synthesis. PLOS ONE. 2019;14(6):e0218403. [DOI:10.1371/journal.pone.0218403] [PMID]
3. World Health Organization. Obesity and overweight. Geneva: WHO; 2024.
4. de Onis M, Garza C, Victora CG, Onyango AW, Frongillo EA, Martines J. The WHO multicentre growth reference study: Planning, study design, and methodology. Food and Nutrition Bulletin. 2004;25(1 Suppl 1):S15-26. [DOI:10.1177/15648265040251S104] [PMID]
5. de Onis M. Development of a WHO growth reference for school-aged children and adolescents. Bulletin of the World Health Organization. 2007;85(9):660-7. [DOI:10.2471/BLT.07.043497] [PMID]
6. Vignerová J, Riedlová J, Bláha P, Kobzová J, Krejčovský L, Brabec M, et al. Celostátní antropologický výzkum dětí a mládeže 2001, Česká republika: Souhrnné výsledky. Praha: Přírodovědecká fakulta UK, Státní zdravotní ústav; 2006.
7. Saleh O. Dynamics of anthropometric characteristics and body composition growth among adolescents (12-15 years old). International Journal of Sports Science Arts. 2020;14(14):31-56. [DOI:10.21608/eijssa.2020.32455.1019]
8. Mertens E, Deforche B, Mullie P, Lefevre J, Charlier R, Knaeps S, et al. Longitudinal study on the association between three dietary indices, anthropometric parameters and blood lipids. Nutrition and Metabolism. 2015;12:47. [DOI:10.1186/s12986-015-0042-1] [PMID]
9. Đorđić V, Tubić T, Jakšić D. The relationship between physical, motor, and intellectual development of preschool children. Procedia - Social and Behavioral Sciences. 2016;233:3-7. [DOI:10.1016/j.sbspro.2016.10.114]
10. Dezenberg CV, Nagy TR, Gower BA, Johnson R, Goran MI. Predicting body composition from anthropometry in pre-adolescent children. International Journal of Obesity and Related Metabolic Disorders. 1999;23(3):253-9. [DOI:10.1038/sj.ijo.0800802] [PMID]
11. Fryar CD, Gu Q, Ogden CL. Anthropometric reference data for children and adults: United States, 2007-2010. Vital and Health Statistics. Series 11. 2012;(252):1-48.
12. Taye AG, Mola DW, Rahman MH. Analyzing the nutritional awareness, dietary practices, attitudes, and performance of U-17 football players in Ethiopia. Physical Education Theory and Methodology. 2024;24(1):110-7. [DOI:10.17309/tmfv.2024.1.14]
13. Sicotte M, Ledoux M, Zunzunegui MV, Ag Aboubacrine S, Nguyen VK, ATARAO group. Reliability of anthropometric measures in a longitudinal cohort of patients initiating ART in West Africa. BMC Medical Research Methodology. 2010;10:102. [DOI:10.1186/1471-2288-10-102] [PMID]
14. Bhattacharya A, Pal B, Mukherjee S, Roy SK. Assessment of nutritional status using anthropometric variables by multivariate analysis. BMC Public Health. 2019;19(1):1045. [DOI:10.1186/s12889-019-7372-2] [PMID]
15. Norgan NG. Body mass index and nutritional status: The effect of adjusting body mass index for the relative sitting height on estimates of the prevalence of chronic energy deficiency, overweight and obesity. Asia Pacific Journal of Clinical Nutrition. 1995;4(1):137-9.
16. Tanner JM. Growth as a mirror of the condition of society: Secular trends and class distinctions. Acta Paediatrica Japonica. 1987;29(1):96-103. [DOI:10.1111/j.1442-200X.1987.tb00015.x] [PMID]
17. Strauss J, Thomas D. Health, nutrition and economic development. Journal of Economic Literature. 1998;36(2):766-817.
18. Park MH, Falconer C, Viner RM, Kinra S. The impact of childhood obesity on morbidity and mortality in adulthood: A systematic review. Obesity Reviews. 2012;13(11):985-1000. [DOI:10.1111/j.1467-789X.2012.01015.x] [PMID]
19. Yang N, He LY, Li ZY, Yang YC, Ping F, Xu LL, et al. Triceps skinfold thickness trajectories and the risk of all-cause mortality: A prospective cohort study. World Journal of Clinical Cases. 2024;12(15):2568-77. [DOI:10.12998/wjcc.v12.i15.2568] [PMID]
20. Nickerson BS, Fedewa MV, Cicone Z, Esco MR. The relative accuracy of skinfolds compared to four-compartment estimates of body composition. Clinical Nutrition. 2020;39(4):1112-6. [DOI:10.1016/j.clnu.2019.04.018] [PMID]
21. Tuan NT, Wang Y. Adiposity assessments: Agreement between dual-energy X-ray absorptiometry and anthropometric measures in U.S. children. Obesity. 2014;22(6):1495-504. [DOI:10.1002/oby.20689] [PMID]
22. Freedman DS, Ogden CL, Blanck HM, Borrud LG, Dietz WH. The abilities of body mass index and skinfold thicknesses to identify children with low or elevated levels of dual-energy X-ray absorptiometry-determined body fatness. The Journal of Pediatrics. 2013;163(1):160-6.e1. [DOI:10.1016/j.jpeds.2012.12.093] [PMID]
23. Li W, Yin H, Chen Y, Liu Q, Wang Y, Qiu D, et al. Associations between adult triceps skinfold thickness and all-cause, cardiovascular and cerebrovascular mortality in NHANES 1999-2010: A retrospective national study. Frontiers in Cardiovascular Medicine. 2022;9:858994. [DOI:10.3389/fcvm.2022.858994] [PMID]
24. Reilly JJ, Wilson J, Durnin JV. Determination of body composition from skinfold thickness: A validation study. Archives of Disease in Childhood. 1995;73(4):305-10. [DOI:10.1136/adc.73.4.305] [PMID]
25. Widiyani T, Suryobroto B, Budiarti S, Hartana A. The growth of body size and somatotype of Javanese children aged 4 to 20 years. Hayati Journal of Biosciences. 2011;18(4):182-92. [DOI:10.4308/hjb.18.4.182]
26. Rahman MH, Sharma JP. An analysis of indices and ratios in anthropometric body measurements among team sports athletes. International Journal of Scientific Reports. 2024;10(4):111-9. [DOI:10.18203/issn.2454-2156.IntJSciRep20240714]
27. Marfell-Jones M, Olds T, Stewart A, Carter L. International Standards for Anthropometric Assessment. Potchefstroom: International Society for the Advancement of Kinanthropometry; 2006. [DOI:10.4324/9780203970157] [PMID]
28. Norton KI. Standards for anthropometry assessment. In: Norton KI, Olds T, editors. Kinanthropometry and Exercise Physiology. London: Routledge; 2018. p. 68-137. [DOI:10.4324/9781315385662-4] [PMID]
29. Lohman TG, Roche AF, Martorell R, editors. Anthropometric Standardization Reference Manual. Champaign (IL): Human Kinetics; 1988.
30. Gibson RS. Principles of Nutritional Assessment: Body Composition. 3rd ed. Oxford: Oxford University Press; 2024.
31. Wells JC, Fewtrell MS. Measuring body composition. Archives of Disease in Childhood. 2006;91(7):612-7. [DOI:10.1136/adc.2005.085522] [PMID]
32. Slaughter MH, Lohman TG, Boileau RA, Horswill CA, Stillman RJ, Van Loan MD, et al. Skinfold equations for estimation of body fatness in children and youth. Human Biology. 1988;60(5):709-23.
33. Malina RM, Bouchard C, Bar-Or O. Growth, Maturation, and Physical Activity. 2nd ed. Champaign (IL): Human Kinetics; 2004. [DOI:10.5040/9781492596837]
34. Tanner JM. Principles of growth standards. Acta Paediatrica Scandinavica. 1990;79(10):963-7. [DOI:10.1111/j.1651-2227.1990.tb11361.x] [PMID]
35. Delemarre-van de Waal HA. Regulation of puberty. Best Practice and Research: Clinical Endocrinology and Metabolism. 1993;7(1):1-15. [DOI:10.1053/beem.2001.0176] [PMID]
36. Rogol AD, Clark PA, Roemmich JN. Growth and pubertal development in children and adolescents: Effects of diet and physical activity. American Journal of Clinical Nutrition. 2000;72(2 Suppl):521S-8S. [DOI:10.1093/ajcn/72.2.521S] [PMID]
37. Cole TJ, Bellizzi MC, Flegal KM, Dietz WH. Establishing a standard definition for child overweight and obesity worldwide: International survey. BMJ. 2000;320(7244):1240-3. [DOI:10.1136/bmj.320.7244.1240] [PMID]
38. World Health Organization. Growth reference data for 5-19 years. Geneva: WHO; 2007.
39. Beunen G, Malina RM. Growth and physical performance relative to the timing of the adolescent spurt. Exercise and Sport Sciences Reviews. 1988;16:503-40. [DOI:10.1249/00003677-198800160-00018] [PMID]
40. McCarthy HD, Cole TJ, Fry T, Jebb SA, Prentice AM. Body fat reference curves for children. International Journal of Obesity. 2006;30(4):598-602. [DOI:10.1038/sj.ijo.0803232] [PMID]
41. Freedman DS, Mei Z, Srinivasan SR, Berenson GS, Dietz WH. Cardiovascular risk factors and excess adiposity among overweight children and adolescents: The Bogalusa Heart Study. The Journal of Pediatrics. 2007;150(1):12-7.e2. [DOI:10.1016/j.jpeds.2006.08.042] [PMID]
42. Kuczmarski RJ, Ogden CL, Guo SS, Grummer-Strawn LM, Flegal KM, Mei Z, et al. Systematic review of the health benefits of physical activity and fitness in school-aged children and youth. International Journal of Behavioral Nutrition and Physical Activity. 2010;7:40. [DOI:10.1186/1479-5868-7-40] [PMID]
43. Ortega FB, Ruiz JR, Castillo MJ, Sjöström M. Physical fitness in childhood and adolescence: A powerful marker of health. International Journal of Obesity. 2008;32(1):1-11. [DOI:10.1038/sj.ijo.0803774] [PMID]
44. Sadri SF, Saleki M. The effect of a combined scapula and shoulder exercise program with kinesio tape on pain, shoulder proprioception, and upper limb function in swimmers with shoulder impingement syndrome. Journal of Sport Biomechanics. 2024;10(2):144-58. [DOI:10.61186/JSportBiomech.10.2.144]
45. Lohman TG. Advances in Body Composition Assessment. Champaign (IL): Human Kinetics; 1992.
46. Wang Y, Monteiro C, Popkin BM. Trends of obesity and underweight in older children and adolescents in the United States, Brazil, China, and Russia. American Journal of Clinical Nutrition. 2002;75(6):971-7. [DOI:10.1093/ajcn/75.6.971] [PMID]
47. Janssen I, LeBlanc AG. Systematic review of the health benefits of physical activity and fitness in school-aged children and youth. International Journal of Behavioral Nutrition and Physical Activity. 2010;7:40. [DOI:10.1186/1479-5868-7-40] [PMID]
48. Tahan MJ, Zandi S, Mousavi SH. Prediction of gymnastics back salto biomechanics by anthropometric characteristics. Journal of Sport Biomechanics. 2025;11(2):114-30. [DOI:10.61186/JSportBiomech.11.2.114]
49. Bayati A, Sadeghi H, Yousefian Molla R. Postural and musculoskeletal assessment of Iranian national shooting team athletes. Journal of Sport Biomechanics. 2025;11(2):132-47. [DOI:10.61186/JSportBiomech.11.2.132]
| Rights and permissions | |
 |
This work is licensed under a Creative Commons Attribution-NonCommercial 4.0 International License. |
Journal of Sport Biomechanics
Department of Sport Biomechanics, Faculty of Humanities, Islamic Azad University, Hamedan Branch, Prof. Mousivand Blvd, Imam Khomeini Blvd, Hamedan, Iran.
Journal Tel: +98 81 34494042
Website: http://biomechanics.iauh.ac.ir
Email: sportbiomechanics@iauh.ac.ir
