

Volume 12, Issue 3 (11-2026)
J Sport Biomech 2026, 12(3): 570-604 |
Back to browse issues page




Download citation:
BibTeX | RIS | EndNote | Medlars | ProCite | Reference Manager | RefWorks
Send citation to:


BibTeX | RIS | EndNote | Medlars | ProCite | Reference Manager | RefWorks
Send citation to:
Abbasi S, Farahpour N, Heidari B, Moisan G, Allard P. Pivoting Gait Reveals Side-Specific Deficits in Horizontal Forces in Adolescent Idiopathic Scoliosis with Lumbar Curvatures: A Cross-Sectional Study. J Sport Biomech 2026; 12 (3) :570-604
URL: http://biomechanics.iauh.ac.ir/article-1-511-en.html
URL: http://biomechanics.iauh.ac.ir/article-1-511-en.html


1- Department of Sport Biomechanics, Faculty of Sport Sciences, Bu-Ali Sina University, Hamedan, Iran.
2- Department of Orthopedics, School of Medicine, Hamedan University of Medical Sciences, Hamedan, Iran.
3- Department of Human Kinetics, Université du Québec à Trois-Rivières, Trois-Rivières, Québec, Canada.
4- Kinesiology Department, Montreal University, Québec, Canada.
2- Department of Orthopedics, School of Medicine, Hamedan University of Medical Sciences, Hamedan, Iran.
3- Department of Human Kinetics, Université du Québec à Trois-Rivières, Trois-Rivières, Québec, Canada.
4- Kinesiology Department, Montreal University, Québec, Canada.
Keywords: Adolescent idiopathic scoliosis, Lumbar scoliosis, Pivoting gait, Ground reaction force, Spatiotemporal parameters
Full-Text [PDF 3273 kb]
(184 Downloads)
| Abstract (HTML) (982 Views)
Full-Text: (288 Views)
1. Introduction
Adolescent idiopathic scoliosis (AIS) is a complex 3D spinal deformity, defined by a lateral curve ˃10º, axial rotation and the sagittal profile alterations (1, 2), including altered thoracic kyphosis and lumbar lordosis (3). AIS affects 1-3% of adolescents, making it a significant orthopedic concern (1). Although its etiology remains idiopathic, a multifactorial model involving genetic predisposition (4, 5), hormonal influences (6), and intrinsic muscular abnormalities (e.g., altered type I/II fiber ratios in paraspinal muscles) (7), is widely accepted.
AIS progression is similarly multifactorial, with the curve type (particularly thoracic), an initial Cobb angle ˃25° (8), and remaining skeletal growth potential (9) identified as significant predictors of both curve progression and the eventual need for surgical intervention (10). Biomechanically, it is hypothesized that asymmetric spinal loading, potentially stemming from alterations in pelvic alignment (11) and impaired neuromuscular control (12), may create a vicious cycle that drives progression. This disrupted biomechanics manifests functionally as poor balance control (13, 14) which has been consistently documented in AIS patients during both static standing and dynamic activities (15).
Gait, as a fundamental and dynamic activity, provides a critical window into these neuromusculoskeletal deficits. In healthy individuals, the spine naturally undergoes subtle, coordinated lateral bending and axial rotation of its vertebral segments during walking, creating a temporary S-shaped curvature that facilitates weight transfer and maintains balance (16). In AIS, this harmonious motion is disrupted (17). In the general population, the gait pattern is affected by different parameters, such as walking speed (18, 19), carrying a load (20, 21), age (22, 23), body mass index (BMI) (24), Toe-Out and Toe-In (25), gender (23, 26), treadmill walking (27), and emotions (28). The deformed spine acts as an off-center mass, challenging the body's postural control systems and leading to altered gait mechanics (29-32). Intriguingly, some studies have suggested a dynamic interaction between the spinal deformity and gait forces, with one study reporting that the maximum Cobb angle coincides with the peak ground reaction force (GRF) during the braking and propulsion phases of walking (17). This suggests that the forces generated during each step may not only be a consequence of the deformity but could also play a role in its progression. Therefore, a detailed analysis of gait biomechanics under various conditions is paramount to understanding the pathomechanics of AIS, its progression mechanisms, and for developing targeted, effective rehabilitation protocols.
Commonly reported alterations include decreased walking speed (33, 34), step length (35), stride length (30, 33), cadence and a reduction in stance time and frontal plane pelvic motion (35, 36). Furthermore, gait in AIS is frequently characterized by asymmetrical GRF patterns (15, 37) and altered pelvic kinematics (17, 35, 38), reflecting the body's attempt to compensate for the truncal imbalance. However, the literature is not entirely consistent, with some studies reporting normal spatiotemporal parameters, such as walking speed (39) and step length (36). These discrepancies suggest a critical methodological issue that hinders a clear understanding of AIS gait.
A primary limitation pervasive in much of the existing research is the predominant focus on straight-line walking. While informative, this task may not be demanding enough to fully expose underlying neuromusculoskeletal deficits. In contrast, more complex, high-demand maneuvers like pivoting place greater stress on the postural control system, requiring rapid generation and dissipation of rotational forces and precise control of whole-body angular momentum. As Dixon et al. (2013, 2014) demonstrated in studies of typically developing (TD) children, a 90° turning gait can reveal weaknesses and motor control deficits that remain hidden during straight-line walking (40, 41). For an individual with AIS, whose balance is already challenged, a pivoting task would likely exacerbate asymmetries and provide a more sensitive assessment of functional limitation. Despite this, pivoting remains severely under-investigated in the scoliosis population (42).
An even more significant limitation is the common practice of grouping all types of AIS (e.g., thoracic, lumbar, thoracolumbar) into a single, heterogeneous cohort. This approach is biomechanically problematic. The location of the spinal curvature dictates the primary lever arm of the deformity and has direct implications for pelvic and lower limb biomechanics. For instance, a right thoracic scoliosis primarily affects the rib cage and shoulder girdle, with pelvic changes often being compensatory. On the other hand, a lumbar scoliosis has its apex in the lumbar spine, directly influencing the orientation and motion of the pelvis, the foundation for gait. Crucially, in lumbar scoliosis, the lumbar vertebrae rotate toward the convex side, while the pelvis often rotates toward the concave side (43). This direct mechanical linkage suggests that the biomechanical consequences for gait, particularly the generation of GRFs, must differ fundamentally between lumbar and thoracic curves. Moreover, even within the lumbar scoliosis population, the polarity of the curve (right vs. left convexity) must be considered, as it dictates the side of pelvic elevation and the specific muscular demands for stability. Combining these distinct phenotypes into one group inevitably introduces "noise," averaging out unique adaptive patterns and leading to potentially misleading or diluted conclusions about the biomechanical properties of any single curve type. Recent work from our group has demonstrated that adolescents with right- and left-sided lumbar scoliosis exhibit distinct adaptations in center of pressure and free moment dynamics during straight gait, underscoring the necessity of analyzing scoliosis curvature directions separately (44).
Therefore, to address these methodological gaps, this study aims to conduct a detailed comparative analysis of spatiotemporal parameters and three-dimensional GRFs during both straight walking and a standardized pivoting task in a homogeneous group of individuals with lumbar scoliosis, further stratified by curve polarity (right vs. left convexity), and a matched control group. Based on the direct mechanical relationship between the lumbar spine and the pelvis, it is hypothesized that: a) lumbar scoliosis is associated with significant alterations in spatiotemporal and GRF components during both straight and pivoting gait compared to neurotypical individuals, and b) these alterations will manifest differently between the right lumbar (RL) and left lumbar (LL) scoliosis subgroups, particularly in the horizontal (mediolateral and anteroposterior) GRF components during the mechanically demanding pivoting task. By focusing on a specific curve type and polarity, this research seeks to provide a clearer, more accurate biomechanical profile, which is an essential prerequisite for developing phenotype-specific rehabilitation protocols aimed at improving gait symmetry, reducing abnormal joint loading, and enhancing functional capacity.
2. Methods
2.1. Participants
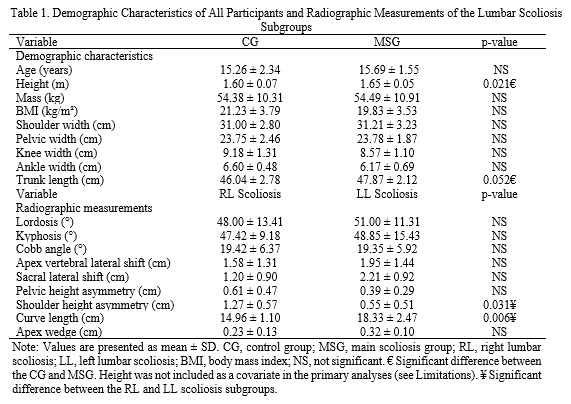
This cross-sectional study included 30 adolescent girls: 14 patients with lumbar adolescent idiopathic scoliosis (AIS) (main scoliosis group, MSG) and 16 healthy controls (control group, CG). The MSG was further divided into two subgroups: right lumbar (RL) scoliosis (N=7) and left lumbar (LL) scoliosis (N=7). The MSG was analyzed only for comparison with previous studies that typically pool curve types. The primary hypothesis testing, however, was performed on the stratified RL and LL subgroups, as pooling obscures polarity-specific adaptations. The demographic information, Cobb angles and the other radiographic parameters for each scoliosis subgroup are detailed in Table 1. The apex of the major curvature for all patients was located at either the L2 or L3 vertebral level. In each group, according to the Nash and Moe classification (45), the amount of apical vertebral rotation was classified into grade 1 (N=5) and grade 2 (N=2).
Adolescent idiopathic scoliosis (AIS) is a complex 3D spinal deformity, defined by a lateral curve ˃10º, axial rotation and the sagittal profile alterations (1, 2), including altered thoracic kyphosis and lumbar lordosis (3). AIS affects 1-3% of adolescents, making it a significant orthopedic concern (1). Although its etiology remains idiopathic, a multifactorial model involving genetic predisposition (4, 5), hormonal influences (6), and intrinsic muscular abnormalities (e.g., altered type I/II fiber ratios in paraspinal muscles) (7), is widely accepted.
AIS progression is similarly multifactorial, with the curve type (particularly thoracic), an initial Cobb angle ˃25° (8), and remaining skeletal growth potential (9) identified as significant predictors of both curve progression and the eventual need for surgical intervention (10). Biomechanically, it is hypothesized that asymmetric spinal loading, potentially stemming from alterations in pelvic alignment (11) and impaired neuromuscular control (12), may create a vicious cycle that drives progression. This disrupted biomechanics manifests functionally as poor balance control (13, 14) which has been consistently documented in AIS patients during both static standing and dynamic activities (15).
Gait, as a fundamental and dynamic activity, provides a critical window into these neuromusculoskeletal deficits. In healthy individuals, the spine naturally undergoes subtle, coordinated lateral bending and axial rotation of its vertebral segments during walking, creating a temporary S-shaped curvature that facilitates weight transfer and maintains balance (16). In AIS, this harmonious motion is disrupted (17). In the general population, the gait pattern is affected by different parameters, such as walking speed (18, 19), carrying a load (20, 21), age (22, 23), body mass index (BMI) (24), Toe-Out and Toe-In (25), gender (23, 26), treadmill walking (27), and emotions (28). The deformed spine acts as an off-center mass, challenging the body's postural control systems and leading to altered gait mechanics (29-32). Intriguingly, some studies have suggested a dynamic interaction between the spinal deformity and gait forces, with one study reporting that the maximum Cobb angle coincides with the peak ground reaction force (GRF) during the braking and propulsion phases of walking (17). This suggests that the forces generated during each step may not only be a consequence of the deformity but could also play a role in its progression. Therefore, a detailed analysis of gait biomechanics under various conditions is paramount to understanding the pathomechanics of AIS, its progression mechanisms, and for developing targeted, effective rehabilitation protocols.
Commonly reported alterations include decreased walking speed (33, 34), step length (35), stride length (30, 33), cadence and a reduction in stance time and frontal plane pelvic motion (35, 36). Furthermore, gait in AIS is frequently characterized by asymmetrical GRF patterns (15, 37) and altered pelvic kinematics (17, 35, 38), reflecting the body's attempt to compensate for the truncal imbalance. However, the literature is not entirely consistent, with some studies reporting normal spatiotemporal parameters, such as walking speed (39) and step length (36). These discrepancies suggest a critical methodological issue that hinders a clear understanding of AIS gait.
A primary limitation pervasive in much of the existing research is the predominant focus on straight-line walking. While informative, this task may not be demanding enough to fully expose underlying neuromusculoskeletal deficits. In contrast, more complex, high-demand maneuvers like pivoting place greater stress on the postural control system, requiring rapid generation and dissipation of rotational forces and precise control of whole-body angular momentum. As Dixon et al. (2013, 2014) demonstrated in studies of typically developing (TD) children, a 90° turning gait can reveal weaknesses and motor control deficits that remain hidden during straight-line walking (40, 41). For an individual with AIS, whose balance is already challenged, a pivoting task would likely exacerbate asymmetries and provide a more sensitive assessment of functional limitation. Despite this, pivoting remains severely under-investigated in the scoliosis population (42).
An even more significant limitation is the common practice of grouping all types of AIS (e.g., thoracic, lumbar, thoracolumbar) into a single, heterogeneous cohort. This approach is biomechanically problematic. The location of the spinal curvature dictates the primary lever arm of the deformity and has direct implications for pelvic and lower limb biomechanics. For instance, a right thoracic scoliosis primarily affects the rib cage and shoulder girdle, with pelvic changes often being compensatory. On the other hand, a lumbar scoliosis has its apex in the lumbar spine, directly influencing the orientation and motion of the pelvis, the foundation for gait. Crucially, in lumbar scoliosis, the lumbar vertebrae rotate toward the convex side, while the pelvis often rotates toward the concave side (43). This direct mechanical linkage suggests that the biomechanical consequences for gait, particularly the generation of GRFs, must differ fundamentally between lumbar and thoracic curves. Moreover, even within the lumbar scoliosis population, the polarity of the curve (right vs. left convexity) must be considered, as it dictates the side of pelvic elevation and the specific muscular demands for stability. Combining these distinct phenotypes into one group inevitably introduces "noise," averaging out unique adaptive patterns and leading to potentially misleading or diluted conclusions about the biomechanical properties of any single curve type. Recent work from our group has demonstrated that adolescents with right- and left-sided lumbar scoliosis exhibit distinct adaptations in center of pressure and free moment dynamics during straight gait, underscoring the necessity of analyzing scoliosis curvature directions separately (44).
Therefore, to address these methodological gaps, this study aims to conduct a detailed comparative analysis of spatiotemporal parameters and three-dimensional GRFs during both straight walking and a standardized pivoting task in a homogeneous group of individuals with lumbar scoliosis, further stratified by curve polarity (right vs. left convexity), and a matched control group. Based on the direct mechanical relationship between the lumbar spine and the pelvis, it is hypothesized that: a) lumbar scoliosis is associated with significant alterations in spatiotemporal and GRF components during both straight and pivoting gait compared to neurotypical individuals, and b) these alterations will manifest differently between the right lumbar (RL) and left lumbar (LL) scoliosis subgroups, particularly in the horizontal (mediolateral and anteroposterior) GRF components during the mechanically demanding pivoting task. By focusing on a specific curve type and polarity, this research seeks to provide a clearer, more accurate biomechanical profile, which is an essential prerequisite for developing phenotype-specific rehabilitation protocols aimed at improving gait symmetry, reducing abnormal joint loading, and enhancing functional capacity.
2. Methods
2.1. Participants
This cross-sectional study included 30 adolescent girls: 14 patients with lumbar adolescent idiopathic scoliosis (AIS) (main scoliosis group, MSG) and 16 healthy controls (control group, CG). The MSG was further divided into two subgroups: right lumbar (RL) scoliosis (N=7) and left lumbar (LL) scoliosis (N=7). The MSG was analyzed only for comparison with previous studies that typically pool curve types. The primary hypothesis testing, however, was performed on the stratified RL and LL subgroups, as pooling obscures polarity-specific adaptations. The demographic information, Cobb angles and the other radiographic parameters for each scoliosis subgroup are detailed in Table 1. The apex of the major curvature for all patients was located at either the L2 or L3 vertebral level. In each group, according to the Nash and Moe classification (45), the amount of apical vertebral rotation was classified into grade 1 (N=5) and grade 2 (N=2).
2.2. Inclusion and Exclusion Criteria
Patients were included in the MSG if they presented with a primary lumbar curvature greater than 10° (46) and had no prior history of scoliosis treatment. Participants for the CG were required to have a normal musculoskeletal alignment with no spinal deformities. Exclusion criteria for all participants included: a history of low back pain within the past 10 years, lower limb length discrepancies exceeding 1cm (35, 47), a history of major surgery (48), or the presence of a secondary curvature greater than 10° in the scoliosis group. All participants were right-handed and right-footed.
The study protocol was approved by the Ethical Committee of the University (ID: IR.BASU.REC.1399.003; May 02, 2020). Before participation, written informed consent was obtained from all participants and their parents or legal guardians.
2.3. Tools
A Qualisys motion capture system with eight cameras (200 Hz) (Version: 2020.3, Qualisys AB, 11/23/2020, www.qualisys.com, Kvarnbergsgatan2, 41105, Gothenburg, Sweden) and two Kistler force plates (40 × 60 cm) (2000 Hz) were synchronized and used to collect the spatiotemporal and ground reaction forces (GRF) during gait. Cameras were calibrated in a cubic volume (1 m wide × 4m long × 2 m high) with the positive X, Y, and Z axes oriented to the right, forward, and upward directions, respectively.
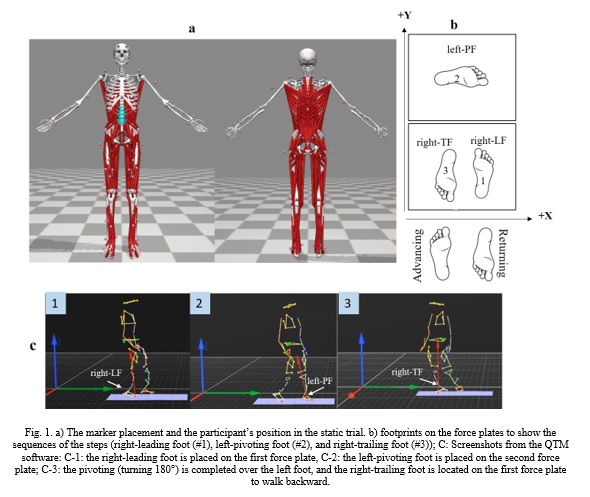
Sixty-four spherical reflective markers (17 mm in diameter) were placed on body landmarks to build the full-body lumbar spine model (modified FBLS model) (49) and quantify spatiotemporal variables (Fig 1a).
2.4. Movement task
First, the participant’s static upright standing position was recorded to scale the model (Fig 1a). Then, five straight gait trials, five trials for pivoting over the right foot, and five trials for pivoting over the left foot were collected at the participant’s self-selected speed. In the straight gait trials, the participant walked on an 18m walkway, stepping onto the force plates located at the midpoint of the walkway with each foot in succession. The pivoting gait task required participants to walk forward along the +Y axis, execute a 180° pivot turn, and continue walking backward along the Y axis in a continuous motion. Each trial began with the participant taking 7-8 steps to approach the force plates. The "leading foot" (LF) was then placed on the first force plate while still facing the +Y direction. Subsequently, the "pivoting foot" (PF) was placed on the second force plate in a 90° internally rotated position to initiate the turn (Fig 1b). The participant then completed a 180° pivot over the stationary PF. Following the pivot, the original leading foot landed again on the first force plate, now designated as the "trailing foot" (TF) facing the -Y direction. The participant then continued walking back to the starting position (Fig 1b). The steps of pivoting gait (LF, PF and TF) are illustrated in the QTM software (Fig 1c).
Patients were included in the MSG if they presented with a primary lumbar curvature greater than 10° (46) and had no prior history of scoliosis treatment. Participants for the CG were required to have a normal musculoskeletal alignment with no spinal deformities. Exclusion criteria for all participants included: a history of low back pain within the past 10 years, lower limb length discrepancies exceeding 1cm (35, 47), a history of major surgery (48), or the presence of a secondary curvature greater than 10° in the scoliosis group. All participants were right-handed and right-footed.
The study protocol was approved by the Ethical Committee of the University (ID: IR.BASU.REC.1399.003; May 02, 2020). Before participation, written informed consent was obtained from all participants and their parents or legal guardians.
2.3. Tools
A Qualisys motion capture system with eight cameras (200 Hz) (Version: 2020.3, Qualisys AB, 11/23/2020, www.qualisys.com, Kvarnbergsgatan2, 41105, Gothenburg, Sweden) and two Kistler force plates (40 × 60 cm) (2000 Hz) were synchronized and used to collect the spatiotemporal and ground reaction forces (GRF) during gait. Cameras were calibrated in a cubic volume (1 m wide × 4m long × 2 m high) with the positive X, Y, and Z axes oriented to the right, forward, and upward directions, respectively.
Sixty-four spherical reflective markers (17 mm in diameter) were placed on body landmarks to build the full-body lumbar spine model (modified FBLS model) (49) and quantify spatiotemporal variables (Fig 1a).
2.4. Movement task
First, the participant’s static upright standing position was recorded to scale the model (Fig 1a). Then, five straight gait trials, five trials for pivoting over the right foot, and five trials for pivoting over the left foot were collected at the participant’s self-selected speed. In the straight gait trials, the participant walked on an 18m walkway, stepping onto the force plates located at the midpoint of the walkway with each foot in succession. The pivoting gait task required participants to walk forward along the +Y axis, execute a 180° pivot turn, and continue walking backward along the Y axis in a continuous motion. Each trial began with the participant taking 7-8 steps to approach the force plates. The "leading foot" (LF) was then placed on the first force plate while still facing the +Y direction. Subsequently, the "pivoting foot" (PF) was placed on the second force plate in a 90° internally rotated position to initiate the turn (Fig 1b). The participant then completed a 180° pivot over the stationary PF. Following the pivot, the original leading foot landed again on the first force plate, now designated as the "trailing foot" (TF) facing the -Y direction. The participant then continued walking back to the starting position (Fig 1b). The steps of pivoting gait (LF, PF and TF) are illustrated in the QTM software (Fig 1c).
2.5. Data processing and statistical analysis
The raw data were filtered using the 4th-order Butterworth low-pass filter with a cut-off frequency of 6 Hz for kinematic and 50 Hz for force data. The peak values for GRFZ1 (loading response), GRFZ2 (mid-stance), GRFZ3 (push-off), GRFY1 (braking), GRFY2 (propulsion), GRFX1, and GRFX2 (medial-lateral) were extracted and normalized to the body weight (BW). The Impulse (50) for each axis (X, Y, Z) was calculated by integrating the ground reaction force over the stance phase duration using the trapezoidal rule, according to the following equation (1):
The raw data were filtered using the 4th-order Butterworth low-pass filter with a cut-off frequency of 6 Hz for kinematic and 50 Hz for force data. The peak values for GRFZ1 (loading response), GRFZ2 (mid-stance), GRFZ3 (push-off), GRFY1 (braking), GRFY2 (propulsion), GRFX1, and GRFX2 (medial-lateral) were extracted and normalized to the body weight (BW). The Impulse (50) for each axis (X, Y, Z) was calculated by integrating the ground reaction force over the stance phase duration using the trapezoidal rule, according to the following equation (1):
Impulse = Δt × [(F₁ + Fₙ)/2 + ∑ᵢ₌₂ⁿ⁻¹ Fᵢ] (1)
Where, impulse was expressed in Newton-seconds (N·s), F represents the instantaneous ground reaction force (N), Δt is the sampling interval (0.0005 s; corresponding to a force plate sampling frequency of 2000 Hz), n is the number of data points during the stance phase, F₁ is the force at initial contact (first sample), and Fₙ is the force at toe-off (last sample with a force value >10 N). For straight gait, impulse was calculated over the entire stance phase of each foot separately. During pivoting gait, impulse was calculated independently for the leading foot (LF), from initial contact to toe-off before pivoting; the pivoting foot (PF), from initial contact on the second force plate to toe-off after completing the 180° turn; and the trailing foot (TF), from initial contact after the pivot to toe-off during backward walking. The onset of the stance phase was defined as the first sample at which the vertical ground reaction force (GRFz) exceeded 10 N, whereas the end of the stance phase was defined as the last sample before the vertical ground reaction force (GRFz) fell below 10 N.
2.6. Statistical analysis
First, the normality of data distributions was examined using the Shapiro-Wilks test. All data were normally distributed. MANOVA test was used to compare the peak values between the groups. To control for family-wise error due to multiple comparisons within each family of variables (spatiotemporal, impulse, and peak GRF separately), a Bonferroni correction was applied.
The adjusted significance level was set at p < 0.05/number of comparisons within each family. For follow-up pairwise comparisons, the Tukey test was used. For SPM time-series comparisons, independent t-tests were performed with an initial threshold of p < 0.05. However, no cluster-level or FWE correction was applied across the multiple SPM comparisons, which is acknowledged as a limitation. Therefore, SPM findings should be considered exploratory. One-dimensional statistical parametric mapping (SPM) was performed using the spm1d package (version M.0.4.3, MATLAB). All analyses were conducted in MATLAB (R2020b, MathWorks Inc., Natick, MA, USA). No additional spatial smoothing was applied to the GRF curves, as the raw force plate data are inherently smooth and were already low-pass filtered (6 Hz) as part of the standard data processing pipeline.
For each trial, GRFs during the stance phase were linearly interpolated to 101 normalized time points (0–100% of stance). The average GRF-time curve of five repeated trials was calculated for each participant and normalized to body weight (BW) (51). The significance value for SPM comparisons was set to p<0.05. Temporal alignment ensured that 0% and 100% corresponded consistently to initial contact and toe-off, respectively. For each comparison (e.g., RL vs. control), an independent two-sample t-test was conducted at each of the 101 normalized time points, generating an SPM{t} statistic continuum. The critical threshold for hypothesis testing was determined using random field theory (RFT) with a significance level of α = 0.05. This threshold accounts for the temporal smoothness of the data and controls the family-wise error rate (FWER) across the entire stance phase. Clusters exceeding this threshold were considered statistically significant. For each supra-threshold cluster, the cluster-level p-value (FWER-corrected) was computed based on the expected cluster size distribution under the null hypothesis. Assumptions testing: The spm1d implementation assumes independent and identically distributed Gaussian errors. Normality of residuals was verified using Shapiro–Wilk tests. Sphericity assumptions were satisfied, as all comparisons involved independent groups. To address potential confounding by anthropometric differences, height was included as a covariate in post-hoc ANCOVA analyses for the primary significant findings. However, given the exploratory nature of this study, these analyses are presented as supportive evidence.
3. Results
All reported p-values for discrete variables were Bonferroni-corrected. Statistical Parametric Mapping (SPM) results are presented using an uncorrected significance threshold of α=0.05 and should therefore be interpreted with caution.
Table 1 summarizes the demographic characteristics and radiographic measurements of the study participants. The scoliosis and control groups were similar in age (p=0.561). However, participants with scoliosis were, on average, approximately 5 ± 2 cm taller than the control group (p=0.021) and also tended to have greater trunk length (47.87 ± 2.12 vs. 46.04 ± 2.78 cm), although this difference did not reach statistical significance (p=0.052). The radiographic measurements indicated that the RL and LL scoliosis subgroups had comparable Cobb angles, lumbar lordosis, and thoracic kyphosis. However, the RL subgroup exhibited greater shoulder height asymmetry (p=0.031) and a shorter curve length (p=0.006) than the LL subgroup.
3.1. Spatiotemporal Variables
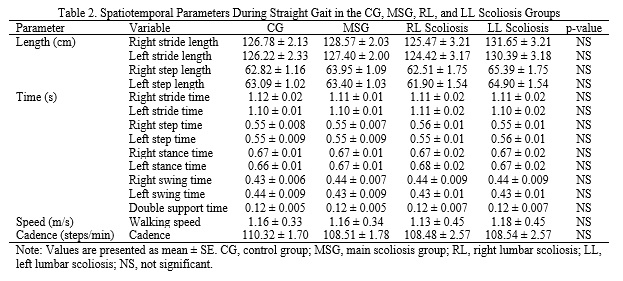
No significant differences in spatiotemporal parameters were observed among the CG, MSG, RL, and LL groups during straight gait (Table 2; all p > 0.05).
2.6. Statistical analysis
First, the normality of data distributions was examined using the Shapiro-Wilks test. All data were normally distributed. MANOVA test was used to compare the peak values between the groups. To control for family-wise error due to multiple comparisons within each family of variables (spatiotemporal, impulse, and peak GRF separately), a Bonferroni correction was applied.
The adjusted significance level was set at p < 0.05/number of comparisons within each family. For follow-up pairwise comparisons, the Tukey test was used. For SPM time-series comparisons, independent t-tests were performed with an initial threshold of p < 0.05. However, no cluster-level or FWE correction was applied across the multiple SPM comparisons, which is acknowledged as a limitation. Therefore, SPM findings should be considered exploratory. One-dimensional statistical parametric mapping (SPM) was performed using the spm1d package (version M.0.4.3, MATLAB). All analyses were conducted in MATLAB (R2020b, MathWorks Inc., Natick, MA, USA). No additional spatial smoothing was applied to the GRF curves, as the raw force plate data are inherently smooth and were already low-pass filtered (6 Hz) as part of the standard data processing pipeline.
For each trial, GRFs during the stance phase were linearly interpolated to 101 normalized time points (0–100% of stance). The average GRF-time curve of five repeated trials was calculated for each participant and normalized to body weight (BW) (51). The significance value for SPM comparisons was set to p<0.05. Temporal alignment ensured that 0% and 100% corresponded consistently to initial contact and toe-off, respectively. For each comparison (e.g., RL vs. control), an independent two-sample t-test was conducted at each of the 101 normalized time points, generating an SPM{t} statistic continuum. The critical threshold for hypothesis testing was determined using random field theory (RFT) with a significance level of α = 0.05. This threshold accounts for the temporal smoothness of the data and controls the family-wise error rate (FWER) across the entire stance phase. Clusters exceeding this threshold were considered statistically significant. For each supra-threshold cluster, the cluster-level p-value (FWER-corrected) was computed based on the expected cluster size distribution under the null hypothesis. Assumptions testing: The spm1d implementation assumes independent and identically distributed Gaussian errors. Normality of residuals was verified using Shapiro–Wilk tests. Sphericity assumptions were satisfied, as all comparisons involved independent groups. To address potential confounding by anthropometric differences, height was included as a covariate in post-hoc ANCOVA analyses for the primary significant findings. However, given the exploratory nature of this study, these analyses are presented as supportive evidence.
3. Results
All reported p-values for discrete variables were Bonferroni-corrected. Statistical Parametric Mapping (SPM) results are presented using an uncorrected significance threshold of α=0.05 and should therefore be interpreted with caution.
Table 1 summarizes the demographic characteristics and radiographic measurements of the study participants. The scoliosis and control groups were similar in age (p=0.561). However, participants with scoliosis were, on average, approximately 5 ± 2 cm taller than the control group (p=0.021) and also tended to have greater trunk length (47.87 ± 2.12 vs. 46.04 ± 2.78 cm), although this difference did not reach statistical significance (p=0.052). The radiographic measurements indicated that the RL and LL scoliosis subgroups had comparable Cobb angles, lumbar lordosis, and thoracic kyphosis. However, the RL subgroup exhibited greater shoulder height asymmetry (p=0.031) and a shorter curve length (p=0.006) than the LL subgroup.
3.1. Spatiotemporal Variables
No significant differences in spatiotemporal parameters were observed among the CG, MSG, RL, and LL groups during straight gait (Table 2; all p > 0.05).
3.2. Temporal Variables During Pivoting Gait
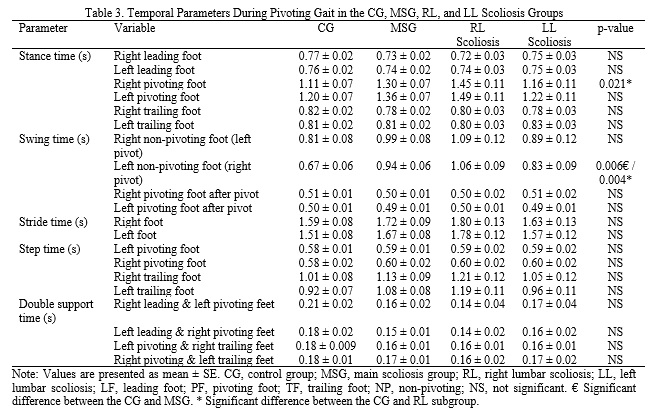
During pivoting gait, significant differences were observed only in stance and swing times (Table 3). The RL subgroup exhibited a significantly longer stance time on the right pivoting foot than the CG (p=0.021). In addition, the swing time of the left non-pivoting foot during right pivoting was significantly longer in both the MSG (p=0.006) and the RL subgroup (p=0.004) than in the CG. No significant differences were observed for the remaining temporal variables (all p > 0.05).
During pivoting gait, significant differences were observed only in stance and swing times (Table 3). The RL subgroup exhibited a significantly longer stance time on the right pivoting foot than the CG (p=0.021). In addition, the swing time of the left non-pivoting foot during right pivoting was significantly longer in both the MSG (p=0.006) and the RL subgroup (p=0.004) than in the CG. No significant differences were observed for the remaining temporal variables (all p > 0.05).
3.3. Dynamic GRF patterns
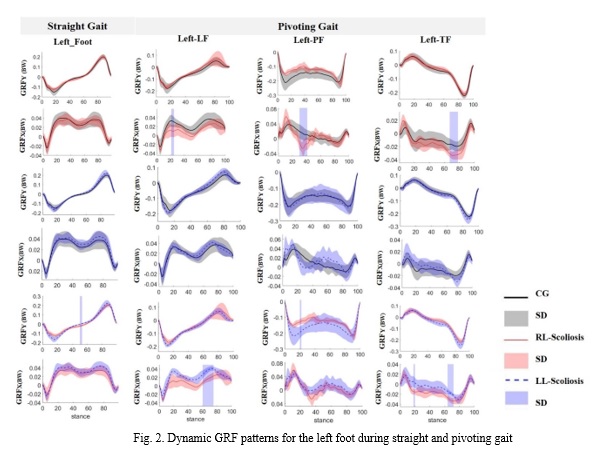
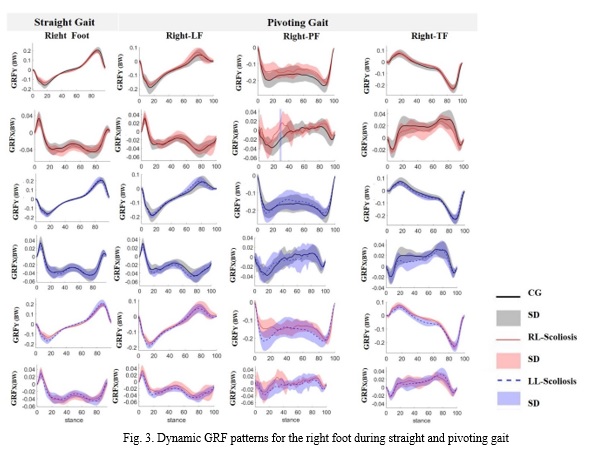
The SPM comparisons for GRFs during the straight gait revealed that the GRFY of the left foot in the RL-scoliosis subgroup was significantly smaller than in the LL-scoliosis subgroup (from 50% to 53% of the stance phase (SP); p=0.004) (Fig 2). In the straight gait, there was no significant difference in GRFs between the two groups for the right foot (Fig 3). However, in pivoting gait, the SPM comparisons revealed that the RL-scoliosis subgroup exhibited smaller GRFX than the CG for the left-LF (from 21% to 25% of SP; p=0.026), and greater GRFX for the left-PF (from 30% to 41% of SP; p=0.001), and the left-TF (from 67% to 78% of SP, p=0.001) (2nd row, Fig 2). The LL-scoliosis subgroup showed nonsignificant differences in the GRFs compared to the CG (3rd and 4th rows in Fig 2). The SPM comparisons also showed that the GRFY of the left-PF (from 21% to 23% of SP; p=0.037), and the GRFX of the left-LF (from 60% to 75% of SP; p=0.001) and left trailing foot (from 18% to 20% of SP; p=0.047, and 64% to 72% of SP; p=0.003) were different between the RL-scoliosis and LL-scoliosis subgroups (Fig 2).
Moreover, the RL-scoliosis subgroup displayed a significantly different GRFx in right-PF (from 28% to 31% of SP; p=0.014) compared to the CG (Fig 3). Regarding the Z axis and the comparisons of MSG and CG, as the figures had space limitations and the comparison of groups and subgroups for both straight and pivoting gait was not significantly different as well, therefore their pattern were not illustrated in Fig. 2 and 3.
The SPM comparisons for GRFs during the straight gait revealed that the GRFY of the left foot in the RL-scoliosis subgroup was significantly smaller than in the LL-scoliosis subgroup (from 50% to 53% of the stance phase (SP); p=0.004) (Fig 2). In the straight gait, there was no significant difference in GRFs between the two groups for the right foot (Fig 3). However, in pivoting gait, the SPM comparisons revealed that the RL-scoliosis subgroup exhibited smaller GRFX than the CG for the left-LF (from 21% to 25% of SP; p=0.026), and greater GRFX for the left-PF (from 30% to 41% of SP; p=0.001), and the left-TF (from 67% to 78% of SP, p=0.001) (2nd row, Fig 2). The LL-scoliosis subgroup showed nonsignificant differences in the GRFs compared to the CG (3rd and 4th rows in Fig 2). The SPM comparisons also showed that the GRFY of the left-PF (from 21% to 23% of SP; p=0.037), and the GRFX of the left-LF (from 60% to 75% of SP; p=0.001) and left trailing foot (from 18% to 20% of SP; p=0.047, and 64% to 72% of SP; p=0.003) were different between the RL-scoliosis and LL-scoliosis subgroups (Fig 2).
Moreover, the RL-scoliosis subgroup displayed a significantly different GRFx in right-PF (from 28% to 31% of SP; p=0.014) compared to the CG (Fig 3). Regarding the Z axis and the comparisons of MSG and CG, as the figures had space limitations and the comparison of groups and subgroups for both straight and pivoting gait was not significantly different as well, therefore their pattern were not illustrated in Fig. 2 and 3.
3.4. Impulse
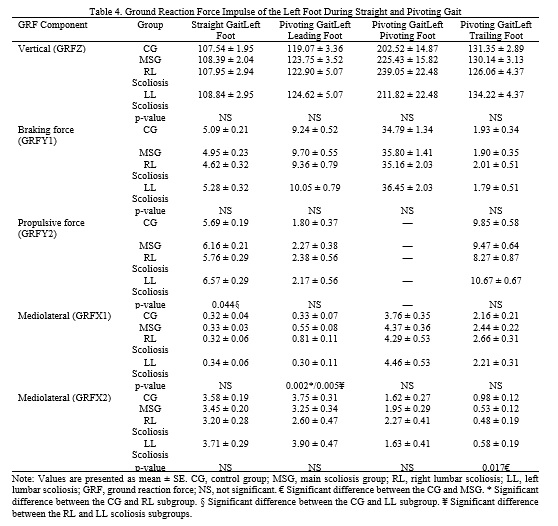
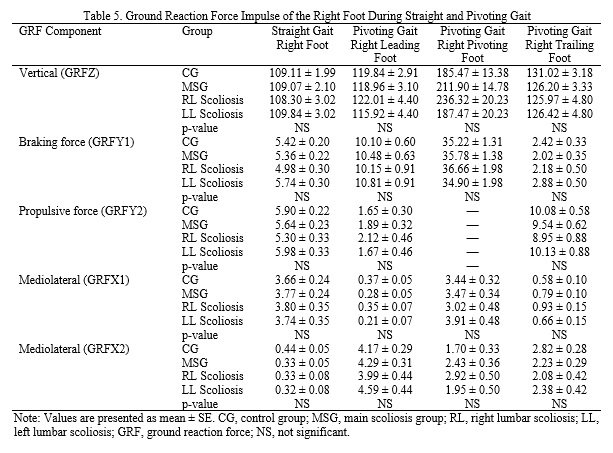
During straight gait, the left-foot propulsion impulse (GRFY2) was significantly greater in the LL subgroup than in the CG (p=0.044; Table 4). No significant between-group differences were observed for the remaining impulse variables during straight gait. During pivoting gait, the RL subgroup exhibited a significantly greater braking impulse (GRFX1) in the left leading foot than both the CG (p=0.002) and the LL subgroup (p=0.005). In addition, the braking impulse (GRFX2) in the left trailing foot differed significantly between the CG and the MSG (p=0.017). No other significant differences were identified among the groups. In the pivoting gait, the lateral impulse (GRFX1) of the left-LF was greater in the RL-scoliosis subgroup (p=0.002) compared to the CG by 0.48 N · s (Table 4). This impulse also significantly differed between the RL-scoliosis and LL-scoliosis subgroups (p=0.005) (Table 4). In contrast, the medial impulse (GRFX2) of the left-TF in the MSG was lower than that in the CG by 0.45 N · s (p=0.017) (Table 4). The impulse of the right foot for all leading, pivoting and trailing feet was not significant between groups and subgroups (p˃0.05) (Table 5).
During straight gait, the left-foot propulsion impulse (GRFY2) was significantly greater in the LL subgroup than in the CG (p=0.044; Table 4). No significant between-group differences were observed for the remaining impulse variables during straight gait. During pivoting gait, the RL subgroup exhibited a significantly greater braking impulse (GRFX1) in the left leading foot than both the CG (p=0.002) and the LL subgroup (p=0.005). In addition, the braking impulse (GRFX2) in the left trailing foot differed significantly between the CG and the MSG (p=0.017). No other significant differences were identified among the groups. In the pivoting gait, the lateral impulse (GRFX1) of the left-LF was greater in the RL-scoliosis subgroup (p=0.002) compared to the CG by 0.48 N · s (Table 4). This impulse also significantly differed between the RL-scoliosis and LL-scoliosis subgroups (p=0.005) (Table 4). In contrast, the medial impulse (GRFX2) of the left-TF in the MSG was lower than that in the CG by 0.45 N · s (p=0.017) (Table 4). The impulse of the right foot for all leading, pivoting and trailing feet was not significant between groups and subgroups (p˃0.05) (Table 5).
4. Discussion
This study aimed to analyze the spatiotemporal and GRF components during the straight and pivoting gait of individuals with lumbar scoliosis compared to the control group. It was hypothesized that a) lumbar scoliosis is associated with altered spatiotemporal and GRF variables in both tasks; and b) these alterations are different between the left and right lumbar scoliosis.
In this study, individuals with scoliosis were taller than those in the control group, consistent with earlier findings (52-54). In contrast, some studies reported no significant height difference between the scoliosis and control groups (39, 55). Research increasingly suggests that a lower BMI, reduced bone mass, and greater height in early childhood are risk factors for adolescent spinal deformities like scoliosis (56-58). Our results specifically confirm the link between greater height and the development of scoliosis. We noted greater shoulder height asymmetry in the RL-scoliosis subgroup compared to the LL-scoliosis subgroup, which may be a neuromuscular adaptation to compensate for spinal misalignment, indicating the need for tailored rehabilitation programs. All scoliosis participants were right-handed. Whether this shoulder height asymmetry in the RL-scoliosis is linked to right-handedness is not clear. The scoliotic patients involved had mild curvature and no pelvic alterations. However, previous studies have linked severe lumbar scoliosis to iliac bone deformity (59, 60). We found similar spatiotemporal variables during the straight gait between the scoliosis and CG, aligning with previous studies for stride and step length (36, 39, 61), stride and step time (61, 62), walking speed and cadence (36, 39, 61, 62), swing time (61, 63), and double support time (39, 61, 62). In contrast, some studies reported shorter strides, slower walking, and a decrease in step length, cadence, longer double support time (33), longer stride time (33, 64), reduced stance time (33, 35, 36) in scoliosis patients during walking. It has been suggested that spine and pelvis misalignments (59), the severity of scoliosis (65), curve location and postural stability (31), are among the important factors linked with spatiotemporal variables. Patients with more severe scoliosis display more pronounced alterations in spatiotemporal variables (38, 54). During pivoting gait, the RL-scoliosis subgroup showed significantly longer stance time on their right pivoting foot and extended swing time on their left non-pivoting foot compared to the control group, suggesting slower turning and increased caution for balance when rotating towards their concave side. To our knowledge, no similar studies on pivoting gait in scoliosis have been performed. The slower turning may indicate weaker neuromuscular and balance performance, but kinematic confirmation is needed. This suggests altered temporal control during pivoting, which may reflect differences in neuromuscular performance; however, direct measures of balance (e.g., center of pressure velocity) or muscle activity are needed for confirmation. Our findings suggest that changes in spatiotemporal components occurred mostly in the RL-scoliosis subgroup than in the LL-scoliosis subgroup, highlighting that each group presents a distinct adaptation. Therefore, combining different scoliosis types in the same study group may not represent the real biomechanical characteristics of scoliosis since the values will be averaged.
This might explain in part the controversial findings regarding the biomechanical behaviour of scoliotic patients in the literature, since each study has a different combination of scoliosis type and severity. A few authors also highlighted that abnormal gait patterns vary depending on the curve type (59, 66). Therefore, researchers should include only one type of scoliosis in their study group to get reliable measurements.
The SPM comparisons for GRFs during the straight gait revealed that the posteroanterior GRFY of the left foot in the RL-scoliosis subgroup was significantly smaller than in the LL-scoliosis subgroup. While the other GRF components were similar between the control and scoliosis groups. Previous research supports these findings partially, showing similar vertical and medial-lateral GRFs between scoliosis and control groups during straight walking, with some studies also noting unchanged anteroposterior GRFs (33, 37, 67, 68). The increased propulsive force in the left foot of the LL-scoliosis subgroup, whose lumbar vertebrae are rotated to the left, is potentially a compensatory mechanism, though kinematics are required to confirm this interpretation to counteract this rotation, allowing them to propel their bodies forward. This significant difference between the RL and LL subgroups, even in straight-line walking, is a critical finding that underscores their unique biomechanical profiles from the outset.
Additionally, the fact that combining patients with RL-scoliosis and LL-scoliosis into a single group masked these differences in spatiotemporal and GRF components reinforces a key methodological point. Separating patients by scoliosis polarity revealed distinct pivoting strategies, highlighting the absolute necessity for homogeneity in scoliosis subgroups for accurate biomechanical measurements.
However, in pivoting gait, the SPM comparisons revealed that the RL-scoliosis subgroup exhibited smaller GRFX than the CG for the left-LF, and greater GRFX for the left-PF, and the left-TF. Greater GRF in the medial-lateral direction during pivoting may indicate a weak equilibrium in the RL-scoliosis group. The SPM comparisons also showed that the GRFY of the left-PF, and the GRFX of the left-LF and left trailing foot were different between the RL-scoliosis and LL-scoliosis subgroups. Moreover, the RL-scoliosis subgroup displayed a significantly decreased GRFX in right-PF compared to the CG. The differences in GRFY between the RL-scoliosis and LL-scoliosis patients may be related to the opposite axial rotation of the lumbar vertebrae in these subgroups. In the RL-scoliosis, the lumbar vertebrae are rotated to the right, while they are rotated to the left in the LL-scoliosis. The rotation of the vertebrae to the ipsilateral side of the curvature in the right and left lumbar scoliosis limits their mobility in rotating ipsilaterally. This limitation in mobility may lead to a slower and biomechanically distinct rotation maneuver.
These findings indicate that individuals with the RL-scoliosis subgroup use different biomechanical strategies when pivoting over the left foot compared to those with the LL-scoliosis subgroup. It is crucial to note that while the LL subgroup exhibited fewer and less pronounced alterations in pivoting compared to the RL subgroup, it was not biomechanically identical to the controls. The significant differences in GRF patterns between the LL and RL subgroups themselves confirm that both represent unique phenotypes. The functional challenge of pivoting simply appears to disproportionately impact and reveal the deficits in the RL subgroup's adaptive strategy.
In the straight gait, the only significant change was an increased propulsion impulse in the left foot of the LL-scoliosis subgroup compared to the CG. In contrast, a different GRF impulse between scoliosis and healthy controls was reported in walking to the forward and lateral side (69-71). The large propulsive impulse observed in the left foot of the LL-scoliosis patients (in the convex side) may be a compensatory neuromuscular function to maintain forward momentum against the rotational pull of the deformity. One interpretation is that this represents a compensatory mechanism. Alternatively, it may reflect an inherent asymmetry in force generation. Without EMG or kinematic data, the underlying cause remains unknown.
In the pivoting gait, the lateral impulse of the left-LF in the RL-scoliosis subgroup was greater than that of both the CG and the LL-scoliosis subgroup. While the medial impulse of the left-TF was smaller in the main scoliosis group compared to the CG. The larger impulse amount in the medial-lateral axis in patients with right lumbar in the left-LF (concave side) probably indicates an attempt to maintain balance and increase the force to change momentum before performing the rotation of the right foot (convex side) to the left side in these patients. So that the convex side foot of these patients performs a forward movement and simultaneously rotates against the rotation of their lumbar vertebrae. This increased lateral impulse likely reflects an active strategy to redirect the body’s COM, a maneuver requiring greater force generation than simply altering the trunk’s rotational velocity.
In summary, individuals with the RL-scoliosis subgroup exhibited more significant and widespread changes in their left PF while turning to their convex side, characterized by a smaller braking (GRFY1) and greater medial-lateral GRFX. The LL-scoliosis subgroup, while demonstrating its own unique strategy as evidenced by differences from both the CG and RL subgroups, exhibited a less disrupted adaptive pattern during the pivoting task. These findings unequivocally demonstrate that the polarity of the curvature (right convexity & left convexity) plays a decisive role in biomechanical behaviour. Therefore, each type requires a specific customized rehabilitation plan and must be considered a distinct entity in research. Our study found that more demanding tasks, such as pivoting, which require postural control while changing body velocity and direction, may reveal more biomechanical alterations than a straight gait (72, 73).
The RL-scoliosis and LL-scoliosis subgroups have fundamentally different biomechanical properties, and therefore, researchers must avoid combining them into a single study group. From a clinical perspective, these findings are preliminary. They suggest that clinicians might consider monitoring right and left lumbar scoliosis patients separately in future observational studies or clinical audits. However, it is premature to recommend polarity-specific rehabilitation protocols based on the current evidence. Larger prospective studies with comprehensive biomechanical and clinical outcome measures are required before such recommendations can be made with confidence.
To our knowledge, this is the first study analyzing the pivoting gait in AIS patients. The few available reports on pivoting/turning gait have included only the normal population in their study. Another advantage of this study is that we included only a single right and a single left lumbar scoliosis with a similar Cobb angle in the study. Our findings revealed that the statistical outcomes changed when the right and left lumbar scoliosis subgroups were separated. This finding highlights the necessity of including a single scoliosis type in a study group when analyzing the biomechanical aspects of the joints in this clinical population. In most previous studies, the scoliosis groups were a mixture of a few curvature types.
The sample size in the scoliosis subgroups is a limitation of this study. However, the main scoliosis sample size is sufficient. It was very difficult to find a patient with a single lumbar curvature (without any compensatory curvature). No correction for multiple comparisons was applied to the SPM analyses. The SPM time-series comparisons were performed across multiple feet, gait conditions, and subgroups with a threshold of p < 0.05. This increases the risk of Type I errors in the SPM results. Future studies should apply cluster-level correction (e.g., FWE or random field theory) for SPM analyses. The findings reported from SPM comparisons should therefore be interpreted as exploratory. The scoliosis group was significantly taller than controls. Height can influence gait mechanics. Although post-hoc ANCOVA with height as a covariate confirmed the robustness of primary findings, this adjustment was not performed a priori. Future studies should control for height through matching or covariate analysis. A significant limitation of this study is the absence of kinematic analysis. Although a full-body marker set was used, we did not quantify joint angles (e.g., pelvic obliquity, trunk rotation, hip abduction/adduction) or segmental angular velocities. Consequently, mechanistic interpretations of the observed GRF differences—such as whether increased mediolateral impulses result from trunk lean, pelvic shift, or hip strategy—remain speculative. Future studies should integrate kinematic analysis with GRF measurements to identify the specific compensatory mechanisms associated with each curve polarity. We have revised the Discussion to temper mechanistic claims where kinematic support is lacking.
5. Conclusion
Lumbar scoliosis is associated with altered spatiotemporal and GRF components, which were predominantly identified in the more demanding pivoting gait, while straight gait comparisons failed to expose the majority of these alterations. The right lumbar scoliosis subgroup is associated with slower pivoting on the right foot when rotating towards the concavity, as well as altered GRF, and larger lateral impulse in pivoting on the left foot. The left lumbar scoliosis subgroup, while displaying a unique biomechanical profile as confirmed by its differences from the RL subgroup, presented with a less pronounced pattern of change during pivoting. Critically, the findings of this preliminary study suggest that right and left lumbar scoliosis may present divergent strategies in gait, particularly during pivoting. These results should be interpreted with caution due to the small sample size and cross-sectional design. If confirmed in larger, longitudinal studies, these polarity-specific differences could inform future research toward developing differentiated rehabilitation approaches. At present, these findings should be considered hypothesis-generating rather than definitive evidence for clinical practice modification. It is also essential for future research to include a homogeneous scoliosis curvature type in each study group to avoid averaging out these critical phenotypic differences.
Acknowledgments
The authors express their appreciation to the participants, their families, and the Health Monitoring and Specialized Sports Center for scoliosis-Mehr for their collaboration. We would also like to extend our thanks to Dr. Mahdi Majlesi, the director of the Sports Biomechanics lab, for providing us with the instrumentation.
Ethical Considerations
Compliance with ethical guidelines
The study protocol was approved by the Ethical Committee of the University (ID: IR.BASU.REC.1399.003; May 02, 2020). Before participation, written informed consent was obtained from all participants and their parents or legal guardians.
Funding
The authors received no specific financial support for this research from any funding agency in the public, commercial, or not-for-profit sectors.
Authors' contributions
Soha Abbasi participated in data collection, data analysis and processing, interpretation of results, text preparation, and editing of the article. Nader Farahpour (corresponding author) participated in project design, research management and supervision, methodology definition, data analysis, interpretation of results, preparation of the first draft of the article, and finalization of the article. Bizhan Heidari contributed to the methodology, clinical examination of the patients, proofreading, and editing. Gabriel Moisan and Paul Allard contributed to the methodology, interpretation of the results, proofreading, and editing.
Conflicts of interest
The authors declare that they have no conflict of interest associated with this study.
This study aimed to analyze the spatiotemporal and GRF components during the straight and pivoting gait of individuals with lumbar scoliosis compared to the control group. It was hypothesized that a) lumbar scoliosis is associated with altered spatiotemporal and GRF variables in both tasks; and b) these alterations are different between the left and right lumbar scoliosis.
In this study, individuals with scoliosis were taller than those in the control group, consistent with earlier findings (52-54). In contrast, some studies reported no significant height difference between the scoliosis and control groups (39, 55). Research increasingly suggests that a lower BMI, reduced bone mass, and greater height in early childhood are risk factors for adolescent spinal deformities like scoliosis (56-58). Our results specifically confirm the link between greater height and the development of scoliosis. We noted greater shoulder height asymmetry in the RL-scoliosis subgroup compared to the LL-scoliosis subgroup, which may be a neuromuscular adaptation to compensate for spinal misalignment, indicating the need for tailored rehabilitation programs. All scoliosis participants were right-handed. Whether this shoulder height asymmetry in the RL-scoliosis is linked to right-handedness is not clear. The scoliotic patients involved had mild curvature and no pelvic alterations. However, previous studies have linked severe lumbar scoliosis to iliac bone deformity (59, 60). We found similar spatiotemporal variables during the straight gait between the scoliosis and CG, aligning with previous studies for stride and step length (36, 39, 61), stride and step time (61, 62), walking speed and cadence (36, 39, 61, 62), swing time (61, 63), and double support time (39, 61, 62). In contrast, some studies reported shorter strides, slower walking, and a decrease in step length, cadence, longer double support time (33), longer stride time (33, 64), reduced stance time (33, 35, 36) in scoliosis patients during walking. It has been suggested that spine and pelvis misalignments (59), the severity of scoliosis (65), curve location and postural stability (31), are among the important factors linked with spatiotemporal variables. Patients with more severe scoliosis display more pronounced alterations in spatiotemporal variables (38, 54). During pivoting gait, the RL-scoliosis subgroup showed significantly longer stance time on their right pivoting foot and extended swing time on their left non-pivoting foot compared to the control group, suggesting slower turning and increased caution for balance when rotating towards their concave side. To our knowledge, no similar studies on pivoting gait in scoliosis have been performed. The slower turning may indicate weaker neuromuscular and balance performance, but kinematic confirmation is needed. This suggests altered temporal control during pivoting, which may reflect differences in neuromuscular performance; however, direct measures of balance (e.g., center of pressure velocity) or muscle activity are needed for confirmation. Our findings suggest that changes in spatiotemporal components occurred mostly in the RL-scoliosis subgroup than in the LL-scoliosis subgroup, highlighting that each group presents a distinct adaptation. Therefore, combining different scoliosis types in the same study group may not represent the real biomechanical characteristics of scoliosis since the values will be averaged.
This might explain in part the controversial findings regarding the biomechanical behaviour of scoliotic patients in the literature, since each study has a different combination of scoliosis type and severity. A few authors also highlighted that abnormal gait patterns vary depending on the curve type (59, 66). Therefore, researchers should include only one type of scoliosis in their study group to get reliable measurements.
The SPM comparisons for GRFs during the straight gait revealed that the posteroanterior GRFY of the left foot in the RL-scoliosis subgroup was significantly smaller than in the LL-scoliosis subgroup. While the other GRF components were similar between the control and scoliosis groups. Previous research supports these findings partially, showing similar vertical and medial-lateral GRFs between scoliosis and control groups during straight walking, with some studies also noting unchanged anteroposterior GRFs (33, 37, 67, 68). The increased propulsive force in the left foot of the LL-scoliosis subgroup, whose lumbar vertebrae are rotated to the left, is potentially a compensatory mechanism, though kinematics are required to confirm this interpretation to counteract this rotation, allowing them to propel their bodies forward. This significant difference between the RL and LL subgroups, even in straight-line walking, is a critical finding that underscores their unique biomechanical profiles from the outset.
Additionally, the fact that combining patients with RL-scoliosis and LL-scoliosis into a single group masked these differences in spatiotemporal and GRF components reinforces a key methodological point. Separating patients by scoliosis polarity revealed distinct pivoting strategies, highlighting the absolute necessity for homogeneity in scoliosis subgroups for accurate biomechanical measurements.
However, in pivoting gait, the SPM comparisons revealed that the RL-scoliosis subgroup exhibited smaller GRFX than the CG for the left-LF, and greater GRFX for the left-PF, and the left-TF. Greater GRF in the medial-lateral direction during pivoting may indicate a weak equilibrium in the RL-scoliosis group. The SPM comparisons also showed that the GRFY of the left-PF, and the GRFX of the left-LF and left trailing foot were different between the RL-scoliosis and LL-scoliosis subgroups. Moreover, the RL-scoliosis subgroup displayed a significantly decreased GRFX in right-PF compared to the CG. The differences in GRFY between the RL-scoliosis and LL-scoliosis patients may be related to the opposite axial rotation of the lumbar vertebrae in these subgroups. In the RL-scoliosis, the lumbar vertebrae are rotated to the right, while they are rotated to the left in the LL-scoliosis. The rotation of the vertebrae to the ipsilateral side of the curvature in the right and left lumbar scoliosis limits their mobility in rotating ipsilaterally. This limitation in mobility may lead to a slower and biomechanically distinct rotation maneuver.
These findings indicate that individuals with the RL-scoliosis subgroup use different biomechanical strategies when pivoting over the left foot compared to those with the LL-scoliosis subgroup. It is crucial to note that while the LL subgroup exhibited fewer and less pronounced alterations in pivoting compared to the RL subgroup, it was not biomechanically identical to the controls. The significant differences in GRF patterns between the LL and RL subgroups themselves confirm that both represent unique phenotypes. The functional challenge of pivoting simply appears to disproportionately impact and reveal the deficits in the RL subgroup's adaptive strategy.
In the straight gait, the only significant change was an increased propulsion impulse in the left foot of the LL-scoliosis subgroup compared to the CG. In contrast, a different GRF impulse between scoliosis and healthy controls was reported in walking to the forward and lateral side (69-71). The large propulsive impulse observed in the left foot of the LL-scoliosis patients (in the convex side) may be a compensatory neuromuscular function to maintain forward momentum against the rotational pull of the deformity. One interpretation is that this represents a compensatory mechanism. Alternatively, it may reflect an inherent asymmetry in force generation. Without EMG or kinematic data, the underlying cause remains unknown.
In the pivoting gait, the lateral impulse of the left-LF in the RL-scoliosis subgroup was greater than that of both the CG and the LL-scoliosis subgroup. While the medial impulse of the left-TF was smaller in the main scoliosis group compared to the CG. The larger impulse amount in the medial-lateral axis in patients with right lumbar in the left-LF (concave side) probably indicates an attempt to maintain balance and increase the force to change momentum before performing the rotation of the right foot (convex side) to the left side in these patients. So that the convex side foot of these patients performs a forward movement and simultaneously rotates against the rotation of their lumbar vertebrae. This increased lateral impulse likely reflects an active strategy to redirect the body’s COM, a maneuver requiring greater force generation than simply altering the trunk’s rotational velocity.
In summary, individuals with the RL-scoliosis subgroup exhibited more significant and widespread changes in their left PF while turning to their convex side, characterized by a smaller braking (GRFY1) and greater medial-lateral GRFX. The LL-scoliosis subgroup, while demonstrating its own unique strategy as evidenced by differences from both the CG and RL subgroups, exhibited a less disrupted adaptive pattern during the pivoting task. These findings unequivocally demonstrate that the polarity of the curvature (right convexity & left convexity) plays a decisive role in biomechanical behaviour. Therefore, each type requires a specific customized rehabilitation plan and must be considered a distinct entity in research. Our study found that more demanding tasks, such as pivoting, which require postural control while changing body velocity and direction, may reveal more biomechanical alterations than a straight gait (72, 73).
The RL-scoliosis and LL-scoliosis subgroups have fundamentally different biomechanical properties, and therefore, researchers must avoid combining them into a single study group. From a clinical perspective, these findings are preliminary. They suggest that clinicians might consider monitoring right and left lumbar scoliosis patients separately in future observational studies or clinical audits. However, it is premature to recommend polarity-specific rehabilitation protocols based on the current evidence. Larger prospective studies with comprehensive biomechanical and clinical outcome measures are required before such recommendations can be made with confidence.
To our knowledge, this is the first study analyzing the pivoting gait in AIS patients. The few available reports on pivoting/turning gait have included only the normal population in their study. Another advantage of this study is that we included only a single right and a single left lumbar scoliosis with a similar Cobb angle in the study. Our findings revealed that the statistical outcomes changed when the right and left lumbar scoliosis subgroups were separated. This finding highlights the necessity of including a single scoliosis type in a study group when analyzing the biomechanical aspects of the joints in this clinical population. In most previous studies, the scoliosis groups were a mixture of a few curvature types.
The sample size in the scoliosis subgroups is a limitation of this study. However, the main scoliosis sample size is sufficient. It was very difficult to find a patient with a single lumbar curvature (without any compensatory curvature). No correction for multiple comparisons was applied to the SPM analyses. The SPM time-series comparisons were performed across multiple feet, gait conditions, and subgroups with a threshold of p < 0.05. This increases the risk of Type I errors in the SPM results. Future studies should apply cluster-level correction (e.g., FWE or random field theory) for SPM analyses. The findings reported from SPM comparisons should therefore be interpreted as exploratory. The scoliosis group was significantly taller than controls. Height can influence gait mechanics. Although post-hoc ANCOVA with height as a covariate confirmed the robustness of primary findings, this adjustment was not performed a priori. Future studies should control for height through matching or covariate analysis. A significant limitation of this study is the absence of kinematic analysis. Although a full-body marker set was used, we did not quantify joint angles (e.g., pelvic obliquity, trunk rotation, hip abduction/adduction) or segmental angular velocities. Consequently, mechanistic interpretations of the observed GRF differences—such as whether increased mediolateral impulses result from trunk lean, pelvic shift, or hip strategy—remain speculative. Future studies should integrate kinematic analysis with GRF measurements to identify the specific compensatory mechanisms associated with each curve polarity. We have revised the Discussion to temper mechanistic claims where kinematic support is lacking.
5. Conclusion
Lumbar scoliosis is associated with altered spatiotemporal and GRF components, which were predominantly identified in the more demanding pivoting gait, while straight gait comparisons failed to expose the majority of these alterations. The right lumbar scoliosis subgroup is associated with slower pivoting on the right foot when rotating towards the concavity, as well as altered GRF, and larger lateral impulse in pivoting on the left foot. The left lumbar scoliosis subgroup, while displaying a unique biomechanical profile as confirmed by its differences from the RL subgroup, presented with a less pronounced pattern of change during pivoting. Critically, the findings of this preliminary study suggest that right and left lumbar scoliosis may present divergent strategies in gait, particularly during pivoting. These results should be interpreted with caution due to the small sample size and cross-sectional design. If confirmed in larger, longitudinal studies, these polarity-specific differences could inform future research toward developing differentiated rehabilitation approaches. At present, these findings should be considered hypothesis-generating rather than definitive evidence for clinical practice modification. It is also essential for future research to include a homogeneous scoliosis curvature type in each study group to avoid averaging out these critical phenotypic differences.
Acknowledgments
The authors express their appreciation to the participants, their families, and the Health Monitoring and Specialized Sports Center for scoliosis-Mehr for their collaboration. We would also like to extend our thanks to Dr. Mahdi Majlesi, the director of the Sports Biomechanics lab, for providing us with the instrumentation.
Ethical Considerations
Compliance with ethical guidelines
The study protocol was approved by the Ethical Committee of the University (ID: IR.BASU.REC.1399.003; May 02, 2020). Before participation, written informed consent was obtained from all participants and their parents or legal guardians.
Funding
The authors received no specific financial support for this research from any funding agency in the public, commercial, or not-for-profit sectors.
Authors' contributions
Soha Abbasi participated in data collection, data analysis and processing, interpretation of results, text preparation, and editing of the article. Nader Farahpour (corresponding author) participated in project design, research management and supervision, methodology definition, data analysis, interpretation of results, preparation of the first draft of the article, and finalization of the article. Bizhan Heidari contributed to the methodology, clinical examination of the patients, proofreading, and editing. Gabriel Moisan and Paul Allard contributed to the methodology, interpretation of the results, proofreading, and editing.
Conflicts of interest
The authors declare that they have no conflict of interest associated with this study.
Type of Study: Research |
Subject:
Special
Received: 2026/04/27 | Accepted: 2026/07/31 | Published: 2026/08/2
Received: 2026/04/27 | Accepted: 2026/07/31 | Published: 2026/08/2
References
1. Weinstein SL, Dolan LA, Cheng JC, Danielsson A, Morcuende JA. Adolescent idiopathic scoliosis. The Lancet. 2008;371(9623):1527-37. [DOI:10.1016/S0140-6736(08)60658-3]
2. Ji R, Liu X, Liu Y, Yan B, Yang J, Lee WY, et al. Kinematic differences and asymmetries during level walking in adolescent patients with different types of mild scoliosis. BioMedical Engineering OnLine. 2024;23(1):22. [DOI:10.1186/s12938-024-01211-5]
3. Kubat O, Ovadia D. Frontal and sagittal imbalance in patients with adolescent idiopathic deformity. Annals of Translational Medicine. 2020;8(2):29. [DOI:10.21037/atm.2019.10.49]
4. Justice CM, Miller NH, Marosy B, Zhang J, Wilson AF. Familial idiopathic scoliosis: evidence of an X-linked susceptibility locus. Spine. 2003;28(6):589-94. [DOI:10.1097/00007632-200303150-00014]
5. Nowak R, Kwiecien M, Tkacz M, Mazurek U. Transforming growth factor-beta signaling in paravertebral muscles in juvenile and adolescent idiopathic scoliosis. BioMed Research International. 2014;2014:594287. [DOI:10.1155/2014/594287]
6. Peng Y, Wang SR, Qiu GX, Zhang JG, Zhuang QY. Research progress on the etiology and pathogenesis of adolescent idiopathic scoliosis. Chinese Medical Journal. 2020;133(4):483-93. [DOI:10.1097/CM9.0000000000000652]
7. Wang Y, Pessin JE. Mechanisms for fiber-type specificity of skeletal muscle atrophy. Current Opinion in Clinical Nutrition and Metabolic Care. 2013;16(3):243-50. [DOI:10.1097/MCO.0b013e328360272d]
8. Wong LP, Cheung PWH, Cheung JPY. Curve type, flexibility, correction, and rotation are predictors of curve progression in patients with adolescent idiopathic scoliosis undergoing conservative treatment: a systematic review. The Bone & Joint Journal. 2022;104-B(4):424-32. [DOI:10.1302/0301-620X.104B4.BJJ-2021-1677.R1]
9. Nam Y, Patel U, Chang DG, Lee YB, Lim J, Yang JH, et al. Curve progression in adolescent idiopathic scoliosis with Cobb angles between 40 and 50 degrees at the late stage of skeletal growth: a minimum 5-year follow-up study. Journal of Clinical Medicine. 2025;14(15):5272. [DOI:10.3390/jcm14155272]
10. Lara T, Astur N, Jones TL, Perake V, Moisan A, Warner WC Jr, et al. The risk of curve progression and surgery in African Americans with adolescent idiopathic scoliosis. Spine Deformity. 2017;5(4):250-4. [DOI:10.1016/j.jspd.2017.01.013]
11. Xu J, Chen M, Wang X, Luo X. Biomechanical changes in adolescent idiopathic scoliosis during walking: a protocol for systematic review and meta-analysis. Medicine. 2023;102(49). [DOI:10.1097/MD.0000000000036528]
12. Allard P, Chavet P, Barbier F, Gatto L, Labelle H, Sadeghi H. Effect of body morphology on standing balance in adolescent idiopathic scoliosis. American Journal of Physical Medicine & Rehabilitation. 2004;83(9):689-97. [DOI:10.1097/01.PHM.0000137344.95784.15]
13. Dalleau G, Allard MS, Beaulieu M, Rivard CH, Allard P. Free moment contribution to quiet standing in able-bodied and scoliotic girls. European Spine Journal. 2007;16(10):1593-9. [DOI:10.1007/s00586-007-0404-0]
14. Sahlstrand T, Örtengren R, Nachemson A. Postural equilibrium in adolescent idiopathic scoliosis. Acta Orthopaedica Scandinavica. 1978;49(4):354-65. [DOI:10.3109/17453677809050088]
15. Yang JH, Suh SW, Sung PS, Park WH. Asymmetrical gait in adolescents with idiopathic scoliosis. European Spine Journal. 2013;22(11):2407-13. [DOI:10.1007/s00586-013-2845-y]
16. Hamill J, Knutzen KM. Biomechanical basis of human movement. 2nd ed. Philadelphia: Lippincott Williams & Wilkins; 2006.
17. Park YS, Lim YT, Koh K, Kim JM, Kwon HJ, Yang JS, et al. Association of spinal deformity and pelvic tilt with gait asymmetry in adolescent idiopathic scoliosis patients: investigation of ground reaction force. Clinical Biomechanics. 2016;36:52-7. [DOI:10.1016/j.clinbiomech.2016.05.005]
18. Liew B, Morris S, Netto K. The effect of backpack carriage on the biomechanics of walking: a systematic review and preliminary meta-analysis. Journal of Applied Biomechanics. 2016;32(6):614-29. [DOI:10.1123/jab.2015-0339]
19. Fukuchi CA, Fukuchi RK, Duarte M. Effects of walking speed on gait biomechanics in healthy participants: a systematic review and meta-analysis. Systematic Reviews. 2019;8(1):153. [DOI:10.1186/s13643-019-1063-z]
20. Carter S, Saghafi A. An exploration of the effects of gait speed and joint movements on minimum toe clearance across the lifespan: a cross-sectional study. Journal of Applied Biomechanics. 2025;41(4):323-32. [DOI:10.1123/jab.2024-0288]
21. Hosseini Y. Comparison of symmetrical and asymmetrical bag-carrying on the vertical ground reaction force during walking in healthy adults. Journal of Sport Biomechanics. 2026;12(2):358-71. [DOI:10.66224/JSportBiomech.12.2.358]
22. Herssens N, Verbecque E, Hallemans A, Vereeck L, Van Rompaey V, Saeys W. Do spatiotemporal parameters and gait variability differ across the lifespan of healthy adults? A systematic review. Gait & Posture. 2018;64:181-90. [DOI:10.1016/j.gaitpost.2018.06.012]
23. Chung MJ, Wang MJJ. The change of gait parameters during walking at different percentages of preferred walking speed for healthy adults aged 20-60 years. Gait & Posture. 2010;31(1):131-5. [DOI:10.1016/j.gaitpost.2009.09.013]
24. Najafian Razavi M. The comparison of gait kinematics in overweight and normal-weight people across age groups. Journal of Sport Biomechanics. 2022;8(3):214-30. [DOI:10.61186/JSportBiomech.8.3.214]
25. Aghamohammadi F, Jalalvand A. The effect of different walking strategies (normal, toe-out, and toe-in) on maximum force and plantar pressure in ten regions of the foot. Journal of Sport Biomechanics. 2025;10(4):262-75. [DOI:10.61186/JSportBiomech.10.4.262]
26. Pollard CD, Heiderscheit BC, Van Emmerik REA, Hamill J. Gender differences in lower extremity coupling variability during an unanticipated cutting maneuver. Journal of Applied Biomechanics. 2005;21(2):143-52. [DOI:10.1123/jab.21.2.143]
27. Holmes HH, Fawcett RT, Roper JA. Changes in spatiotemporal measures and variability during user-driven treadmill, fixed-speed treadmill, and overground walking in young adults: a pilot study. Journal of Applied Biomechanics. 2021;37(3):277-81. [DOI:10.1123/jab.2020-0109]
28. Fawver B, Beatty GF, Naugle KM, Hass CJ, Janelle CM. Emotional state impacts center of pressure displacement before forward gait initiation. Journal of Applied Biomechanics. 2015;31(1):35-40. [DOI:10.1123/JAB.2013-0306]
29. Wu KW, Wang TM, Hu CC, Hong SW, Lee PA, Lu TW. Postural adjustments in adolescent idiopathic thoracic scoliosis during walking. Gait & Posture. 2019;68:423-9. [DOI:10.1016/j.gaitpost.2018.12.024]
30. Mallau S, Bollini G, Jouve JL, Assaiante C. Locomotor skills and balance strategies in adolescents with idiopathic scoliosis. Spine. 2007;32(1). [DOI:10.1097/01.brs.0000251069.58498.eb]
31. Chen PQ, Wang JL, Tsuang YH, Liao TL, Huang PI, Hang YS. The postural stability control and gait pattern of idiopathic scoliosis adolescents. Clinical Biomechanics. 1998;13(1 Suppl 1). [DOI:10.1016/S0268-0033(97)00075-2]
32. Lenke LG, Betz RR, Haher TR, Lapp MA, Merola AA, Harms J, et al. Multisurgeon assessment of surgical decision-making in adolescent idiopathic scoliosis: curve classification, operative approach, and fusion levels. Spine. 2001;26(21):2347-53. [DOI:10.1097/00007632-200111010-00011]
33. Haber CK, Sacco M. Scoliosis: lower limb asymmetries during the gait cycle. Archives of Physiotherapy. 2015;5(1):4. [DOI:10.1186/s40945-015-0001-1]
34. Haddas R, Ju KL, Belanger T, Lieberman IH. The use of gait analysis in the assessment of patients afflicted with spinal disorders. European Spine Journal. 2018;27(8):1712-23. [DOI:10.1007/s00586-018-5569-1]
35. Mahaudens P, Banse X, Mousny M, Detrembleur C. Gait in adolescent idiopathic scoliosis: kinematics and electromyographic analysis. European Spine Journal. 2009;18(4):512-21. [DOI:10.1007/s00586-009-0899-7]
36. Kim DS, Park SH, Goh TS, Son SM, Lee JS. A meta-analysis of gait in adolescent idiopathic scoliosis. Journal of Clinical Neuroscience. 2020;81:196-200. [DOI:10.1016/j.jocn.2020.09.035]
37. Giakas G, Baltzopoulos V, Dangerfield PH, Dorgan JC, Dalmira S. Comparison of gait patterns between healthy and scoliotic patients using time- and frequency-domain analysis of ground reaction forces. Spine. 1996;21(19):2235-42. [DOI:10.1097/00007632-199610010-00011]
38. Syczewska M, Graff K, Kalinowska M, Szczerbik E, Domaniecki J. Does the gait pathology in scoliotic patients depend on the severity of spine deformity? Preliminary results. Acta of Bioengineering and Biomechanics. 2010;12(1):25-8.
39. Tekin S, Yagci G, Topuz S, Demirkiran G. Comparison of gait and sagittal-plane arm swing between individuals with adolescent idiopathic scoliosis and healthy individuals. Acta Orthopaedica Belgica. 2023;89(4):727-34. [DOI:10.52628/89.4.11444]
40. Dixon PC, Stebbins J, Theologis T, Zavatsky AB. Spatiotemporal parameters and lower-limb kinematics of turning gait in typically developing children. Gait & Posture. 2013;38(4):870-5. [DOI:10.1016/j.gaitpost.2013.04.010]
41. Dixon PC, Stebbins J, Theologis T, Zavatsky AB. Ground reaction forces and lower-limb joint kinetics of turning gait in typically developing children. Journal of Biomechanics. 2014;47(15):3726-33. [DOI:10.1016/j.jbiomech.2014.09.011]
42. Wu KW, Lu TW, Lee WC, Ho YT, Huang TC, Wang JH, et al. Altered balance control in thoracic adolescent idiopathic scoliosis during obstructed gait. PLoS One. 2020;15(2). [DOI:10.1371/journal.pone.0228752]
43. Gum JL, Asher MA, Burton DC, Lai SM, Lambart LM. Transverse-plane pelvic rotation in adolescent idiopathic scoliosis: primary or compensatory? European Spine Journal. 2007;16(10):1579-86. [DOI:10.1007/s00586-007-0400-4]
44. Abbasi S, Farahpour N, Heidari B, Moisan G, Allard P. Center of foot pressure and free moment changes during gait in adolescents with right and left scoliosis. The Scientific Journal of Rehabilitation Medicine. 2025;14(4):636-51. [DOI:10.32598/SJRM.14.4.3359]
45. Nash CL Jr, Moe JH. A study of vertebral rotation. The Journal of Bone and Joint Surgery. American Volume. 1969;51(2):223-9. [DOI:10.2106/00004623-196951020-00002]
46. Wen JX, Yang HH, Han SM, Cao L, Wu HZ, Yang C, et al. Trunk balance, head posture and plantar pressure in adolescent idiopathic scoliosis. Frontiers in Pediatrics. 2022;10:979816. [DOI:10.3389/fped.2022.979816]
47. Xi F, Xue X, Ji E, Zhang Q, Zhao S, Li K, et al. Relationship between leg length discrepancy and functional scoliosis in children and adolescents. BMC Musculoskeletal Disorders. 2025;26(1):428. [DOI:10.1186/s12891-025-08693-x]
48. Dufvenberg M, Adeyemi F, Rajendran I, Öberg B, Abbott A. Does postural stability differ between adolescents with idiopathic scoliosis and typically developed? A systematic literature review and meta-analysis. Scoliosis and Spinal Disorders. 2018;13(1):19. [DOI:10.1186/s13013-018-0163-1]
49. Raabe ME, Chaudhari AMW. An investigation of jogging biomechanics using the full-body lumbar spine model: model development and validation. Journal of Biomechanics. 2016;49(7):1238-43. [DOI:10.1016/j.jbiomech.2016.02.046]
50. Robertson DGE, Caldwell GE, Hamill J, Kamen G, Whittlesey SN. Research methods in biomechanics. 2nd ed. Champaign: Human Kinetics; 2013. [DOI:10.5040/9781492595809]
51. Collins JJ, Whittle MW. Influence of gait parameters on the loading of the lower limb. Journal of Biomedical Engineering. 1989;11(5):409-12. [DOI:10.1016/0141-5425(89)90105-2]
52. Normelli H, Sevastik J, Ljung G, Aaro S, Jönsson-Söderström AM. Anthropometric data relating to normal and scoliotic Scandinavian girls. Spine. 1985;10(2):123-6. [DOI:10.1097/00007632-198503000-00002]
53. Shohat M, Shohat T, Nitzan M, Mimouni M, Kedem R, Danon YL. Growth and ethnicity in scoliosis. Acta Orthopaedica Scandinavica. 1988;59(3):310-3. [DOI:10.3109/17453678809149370]
54. Zhu F, Hong Q, Guo X, Wang D, Chen J, Zhu Q, et al. A comparison of foot posture and walking performance in patients with mild, moderate, and severe adolescent idiopathic scoliosis. PLoS One. 2021;16(5). [DOI:10.1371/journal.pone.0251592]
55. Garg B, Gupta M, Mehta N, Malhotra R. Influence of etiology and onset of deformity on spatiotemporal, kinematic, kinetic, and electromyographic gait variables in patients with scoliosis: a prospective comparative study. Spine. 2021;46(6):374-82. [DOI:10.1097/BRS.0000000000003796]
56. Burwell RG, Dangerfield PH, Moulton A, Anderson SI. Etiologic theories of idiopathic scoliosis: autonomic nervous system and the leptin-sympathetic nervous system concept for the pathogenesis of adolescent idiopathic scoliosis. Studies in Health Technology and Informatics. 2008;140:197-207. [DOI:10.3233/978-1-58603-888-5-197]
57. Grivas TB, Burwell RG, Mihas C, Vasiliadis ES, Triantafyllopoulos G, Kaspiris A. Relatively lower body mass index is associated with an excess of severe truncal asymmetry in healthy adolescents: do white adipose tissue, leptin, hypothalamus and sympathetic nervous system influence truncal growth asymmetry? Scoliosis. 2009;4(1):13. [DOI:10.1186/1748-7161-4-13]
58. Hershkovich O, Friedlander A, Gordon B, Arzi H, Derazne E, Tzur D, et al. Association between body mass index, body height, and the prevalence of spinal deformities. The Spine Journal. 2014;14(8):1581-7. [DOI:10.1016/j.spinee.2013.09.034]
59. Mahaudens P, Thonnard JL, Detrembleur C. Influence of structural pelvic disorders during standing and walking in adolescents with idiopathic scoliosis. The Spine Journal. 2005;5(4):427-33. [DOI:10.1016/j.spinee.2004.11.014]
60. Walker AP, Dickson RA. School screening and pelvic tilt scoliosis. The Lancet. 1984;2(8395):152-4. [DOI:10.1016/S0140-6736(84)91059-6]
61. Yazdani S, Farahpour N, Habibi M, Saba MS. Spatiotemporal variables of gait in patients with adolescent idiopathic scoliosis and healthy individuals. Journal of Sport Biomechanics. 2016;2(3):5-14.
62. Lao ML, Chow DHK, Guo X, Cheng JCY, Holmes AD. Impaired dynamic balance control in adolescents with idiopathic scoliosis and abnormal somatosensory evoked potentials. Journal of Pediatric Orthopaedics. 2008;28(8):846-9. [DOI:10.1097/BPO.0b013e31818e1bc9]
63. Kim SH, Kim HJ. Changes in gait parameters in adolescent idiopathic scoliosis. Journal of the Korean Physical Therapy. 2014;26(3):136-9.
64. Alazzawi A, Kaya MH, Büyükturan B, Büyükturan Ö. Comparison of walking parameters in adolescent idiopathic scoliosis and healthy adolescents. Turkish Journal of Health and Sport. 2023;4(1):27-31. [DOI:10.29228/tjhealthsport.67934]
65. Syczewska M, Graff K, Kalinowska M, Szczerbik E, Domaniecki J. Influence of the structural deformity of the spine on the gait pathology in scoliotic patients. Gait & Posture. 2012;35(2):209-13. [DOI:10.1016/j.gaitpost.2011.09.008]
66. Oatis CA. Kinesiology: the mechanics and pathomechanics of human movement. 2nd ed. Philadelphia: Lippincott Williams & Wilkins; 2009.
67. Sung PS, Park MS. Compensatory ground reaction forces during scoliotic gait in subjects with and without right adolescent idiopathic scoliosis. Symmetry. 2021;13(12):2372. [DOI:10.3390/sym13122372]
68. Yazdani S, Farahpour N. Kinetic gait analysis in patients with adolescent idiopathic scoliosis and normal control subjects. Journal of Paramedical Sciences and Rehabilitation. 2017;6(2):48-59.
69. Bruyneel AV, Chavet P, Bollini G, Allard P, Berton E, Mesure S. Lateral steps reveal adaptive biomechanical strategies in adolescent idiopathic scoliosis. Annales de Réadaptation et de Médecine Physique. 2008;51(8):630-41. [DOI:10.1016/j.annrmp.2008.05.004]
70. Bruyneel AV, Chavet P, Bollini G, Allard P, Berton E, Mesure S. Dynamical asymmetries in idiopathic scoliosis during forward and lateral initiation steps. European Spine Journal. 2009;18(2):188-95. [DOI:10.1007/s00586-008-0864-x]
71. Bruyneel AV, Chavet P, Bollini G, Mesure S. Gait initiation reflects the adaptive biomechanical strategies of adolescents with idiopathic scoliosis. Annals of Physical and Rehabilitation Medicine. 2010;53(6-7):372-86. [DOI:10.1016/j.rehab.2010.06.005]
72. Hase K, Stein RB. Analysis of rapid stopping during human walking. Journal of Neurophysiology. 1998;80(1):255-61. [DOI:10.1152/jn.1998.80.1.255]
73. Hase K, Stein RB. Turning strategies during human walking. Journal of Neurophysiology. 1999;81(6):2914-22. [DOI:10.1152/jn.1999.81.6.2914]
| Rights and permissions | |
 |
This work is licensed under a Creative Commons Attribution-NonCommercial 4.0 International License. |

Journal of Sport Biomechanics
Department of Sport Biomechanics, Faculty of Humanities, Islamic Azad University, Hamedan Branch, Prof. Mousivand Blvd, Imam Khomeini Blvd, Hamedan, Iran.
Journal Tel: +98 81 34494042
Website: http://biomechanics.iauh.ac.ir
Email: sportbiomechanics@iauh.ac.ir
