

Volume 12, Issue 4 (2-2027)
J Sport Biomech 2027, 12(4): 792-823 |
Back to browse issues page




Download citation:
BibTeX | RIS | EndNote | Medlars | ProCite | Reference Manager | RefWorks
Send citation to:


BibTeX | RIS | EndNote | Medlars | ProCite | Reference Manager | RefWorks
Send citation to:
Farzollahi H, Jafarnezhadgero A, Mokhtari MalekAbadi A, Dehghani M, Rezazade F. Effect of Running Induced Fatigue on Plantar Pressure Variables in Overweight Males with Pronated Feet Compared to Normal Groups During Walking. J Sport Biomech 2027; 12 (4) :792-823
URL: http://biomechanics.iauh.ac.ir/article-1-564-en.html
URL: http://biomechanics.iauh.ac.ir/article-1-564-en.html
Hossein Farzollahi1 

 , Amirali Jafarnezhadgero *1 , Arefeh Mokhtari MalekAbadi1 , Mahrokh Dehghani1 , Farhad Rezazade1
1- Department of Sports Biomechanics, Faculty of Educational Sciences and Psychology, University of Mohaghegh Ardabili, Ardabil, Iran.
Full-Text [PDF 1870 kb]
(8 Downloads)
| Abstract (HTML) (25 Views)
Full-Text: (10 Views)
Introduction
Obesity has become an increasingly important global public health concern. Individuals who experience obesity during childhood and adolescence are at increased risk of developing cardiovascular diseases, diabetes, and other associated comorbidities in adulthood (1). Previous estimates indicate that more than 300 million people worldwide are classified as obese (2). Furthermore, obesity has been associated with musculoskeletal disorders affecting the lower extremities, such as knee and hip osteoarthritis (3). Recent studies have also demonstrated that the foot may be affected by obesity (4). A systematic review of 25 studies involving 93,224 participants reported a strong association between obesity and nonspecific foot pain in the general population (5).
One possible explanation for the association between obesity and foot pain is that excess body weight increases mechanical loading on the foot. Indeed, previous studies have documented an association between obesity and increased plantar force and pressure (6). However, plantar loading patterns are influenced by factors other than body weight, including foot posture, joint range of motion, and walking speed (7). Previous studies have reported that the prevalence of foot pronation in adults ranges from 20% to 23% (8). Excessive foot pronation, a common lower-extremity musculoskeletal condition, is characterized by a reduction in medial longitudinal arch height and alterations in ankle joint alignment (9). This condition is frequently associated with ankle dysfunction resulting from biomechanical changes during gait (10). Alterations in ankle biomechanics may increase susceptibility to injury in this region. Excessive pronation is typically accompanied by medial displacement and inward inclination of the talus and navicular bones, contributing to a pronated foot posture. Pronated feet have been associated with increased mechanical stress and injury risk at the ankle, knee, and pelvic girdle joints (9). Individuals with excessive foot pronation often exhibit a lowered medial longitudinal arch, internal tibial rotation, femoral internal rotation, knee valgus, and, in cases of hyperpronation, increased lumbar lordosis (11).
Increased foot loading and alterations in plantar pressure associated with obesity have important implications for affected individuals and have attracted considerable attention from healthcare professionals and researchers over the past two decades. Previous studies have investigated these changes using various plantar pressure assessment tools (12). Plantar pressure analysis provides a method for evaluating the relationship between foot posture and lower-limb biomechanics, offering valuable information about the interaction of different lower-limb segments (13). Foot structure and plantar pressure patterns vary according to age, assessment conditions (static or dynamic) (14), and the frequency of assessments across age groups (15), as well as the type and intensity of physical activity. A significant inverse association between plantar pressure and physical activity level has also been reported (16). Plantar pressure assessment can reveal alterations in foot posture and provide information about the forces acting on the foot during standing and walking in healthy individuals and those with various conditions, including obesity. Furthermore, plantar pressure measurements may provide insights into changes associated with lower-limb pain (17), impaired stability, and falls (18). Fatigue is another important physiological factor influencing human movement and performance (19). Physiologically, fatigue can be described as a reduced ability of muscles to generate sufficient force to sustain a given activity (20). Previous research has demonstrated that fatigue reduces voluntary muscle strength and functional capacity, disrupts the coordinated activation of agonist and antagonist muscles, and impairs overall neuromuscular performance and efficiency (21, 22). Evidence from previous studies suggests that fatigue-related reductions in neuromuscular function can substantially affect movement mechanics and patterns of muscle activation (23). Furthermore, fatigue may alter lower-extremity kinetics and potentially increase the risk of musculoskeletal injuries (24).
Consequently, repeated episodes of substantial fatigue have been identified as a potential risk factor for overuse injuries (25), highlighting the importance of appropriate fatigue management (26). Understanding the effects of fatigue on foot pronation and its potential consequences for arch structure is therefore important in biomechanics (27). Fatigue is also characterized by a progressive decline in physical and mental performance (28). During prolonged or repetitive activities, fatigue may result from several mechanisms, including reduced availability of energy substrates, accumulation of metabolites within muscle fibers, and alterations in motor commands originating from the motor cortex (29). Nevertheless, assessments that do not account for fatigue may fail to capture the full complexity of human locomotion, as fatigue-induced changes can significantly alter gait dynamics (30) and foot function (31) in both sports science and clinical settings (32). Athletes participating in endurance competitions or repetitive training programs may experience fatigue-related changes in foot pronation (33), potentially increasing their susceptibility to sports-related conditions, such as Achilles tendon pain and shin splints, and impairing athletic performance (34). Similarly, in clinical settings, individuals with certain foot disorders or pathologies may exhibit altered foot mechanics only after the onset of neuromuscular fatigue (35), emphasizing the need for a more comprehensive understanding of fatigue-induced biomechanical changes. Identifying these changes may provide valuable information for preventing secondary injuries. Accordingly, assessing plantar pressure characteristics before and after fatigue has received considerable attention. Plantar pressure analysis can provide useful information about weight distribution, center of pressure (COP) displacement, and postural biomechanics. Such assessments may improve our understanding of fatigue-related biomechanical adaptations, particularly in individuals with pronated feet.
The present study was based on two hypotheses: (1) running-induced fatigue significantly affects plantar pressure variables during walking in overweight men with pronated feet, and (2) there is a significant interaction between fatigue and group characteristics in plantar pressure variables during walking. Therefore, this study aimed to investigate the effects of running-induced fatigue on plantar pressure variables during walking in overweight men with pronated feet.
Methods
Study Design and Participants
A quasi-experimental study with a pretest–posttest design was conducted. Based on findings from previous studies and an a priori power analysis performed using G*Power software, the minimum required sample size was estimated at 10 participants per group, assuming an effect size of 0.80, a significance level of 0.05, four groups, two measurements, and a correlation of 0.5 between repeated measurements. Accordingly, 40 male participants aged 19–35 years were recruited through convenience sampling from university students in Ardabil Province, Iran. All participants were sedentary young adults and were assigned to four groups according to their body weight status and foot posture. The groups were defined as follows: NN, individuals with non-excessive body weight (20 ≤ BMI < 25 kg/m²) and non-pronated feet (5 < navicular drop < 10 mm; Foot Posture Index [FPI] between 0 and 6); NP, individuals with non-excessive body weight and pronated feet (10 < navicular drop < 19 mm; 10 < FPI ≤ 12); ON, individuals with excessive body weight (25 ≤ BMI ≤ 35 kg/m²) and non-pronated feet; and OP, individuals with excessive body weight and pronated feet.
In the present study, a modified version of the navicular drop test described by Brody was used to determine sagittal-plane displacement of the navicular bone between seated and single-leg standing positions (36). During testing, participants sat on a chair with both feet flat on the ground and their knees flexed at 90°. The most medial aspect of the navicular bone was marked, and its height was measured using a ruler. Participants were then instructed to stand on one leg by flexing the contralateral knee (37). Navicular height was measured again, and the difference between the seated and single-leg standing measurements was recorded as the navicular drop.
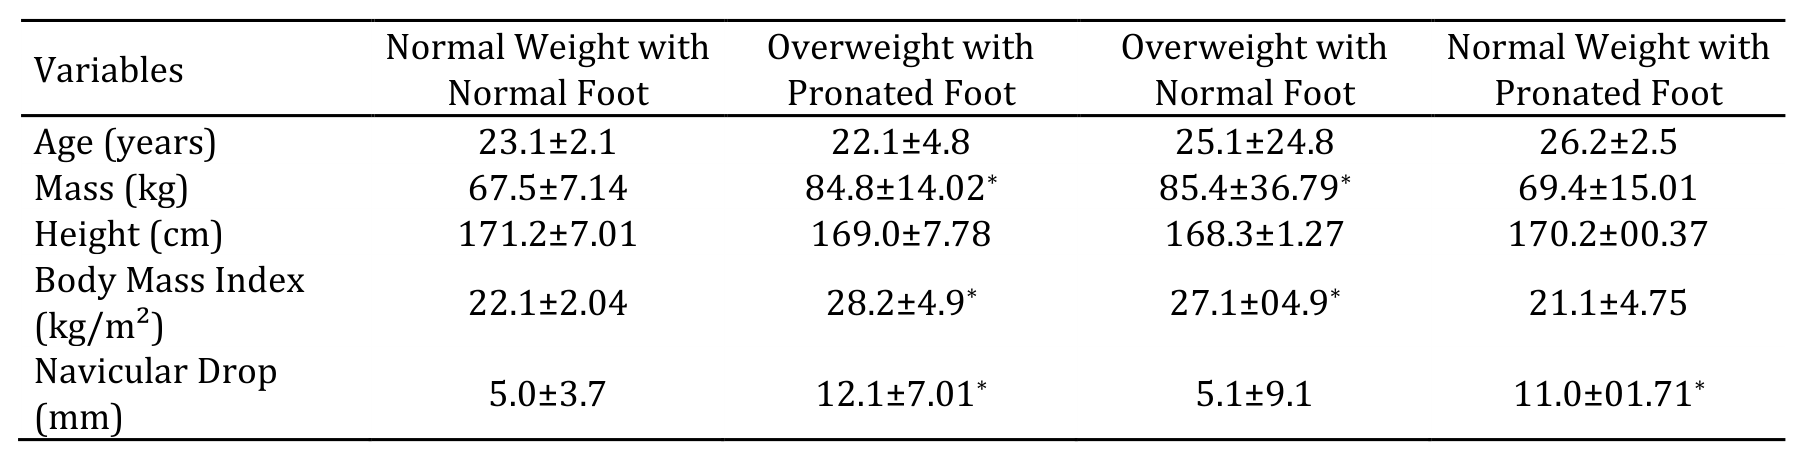
The Foot Posture Index consists of six items used to quantify and classify foot posture (38). FPI scores of 10–12 were classified as indicating overpronated feet, whereas scores of 0–6 were classified as indicating normal foot posture (38). The characteristics of the study groups are presented in Table 1.
Only sedentary individuals were included in the study. A sedentary lifestyle was defined as fewer than 1,000 steps per day, recorded using a pedometer application installed on participants' mobile phones, and no regular physical exercise, defined as fewer than one exercise session per week based on questionnaire responses (39). The exclusion criteria for all groups included participation in physical exercise two to three times per week; a history of musculoskeletal surgery involving the trunk or lower limbs; cardiorespiratory, neuromuscular, or orthopedic disorders (except foot pronation in the NP and OP groups); and a lower-limb length discrepancy greater than 5 mm. All participants exhibited a heel-to-toe walking pattern, as determined from kinematic data. Before participation, all participants were informed about the study objectives and procedures and provided written informed consent. Participation was voluntary, and participants were free to withdraw at any stage without penalty. The confidentiality and anonymity of participants' personal information were maintained throughout the research process. All procedures were conducted in accordance with the ethical principles of the Declaration of Helsinki. The study protocol was reviewed and approved by the Research Ethics Committee of the University of Mohaghegh Ardabili, Iran (IR.UMA.REC.1402.011). Appropriate safety measures were implemented during the fatigue protocol and testing procedures to minimize the risk of injury or discomfort.
Experimental Protocol
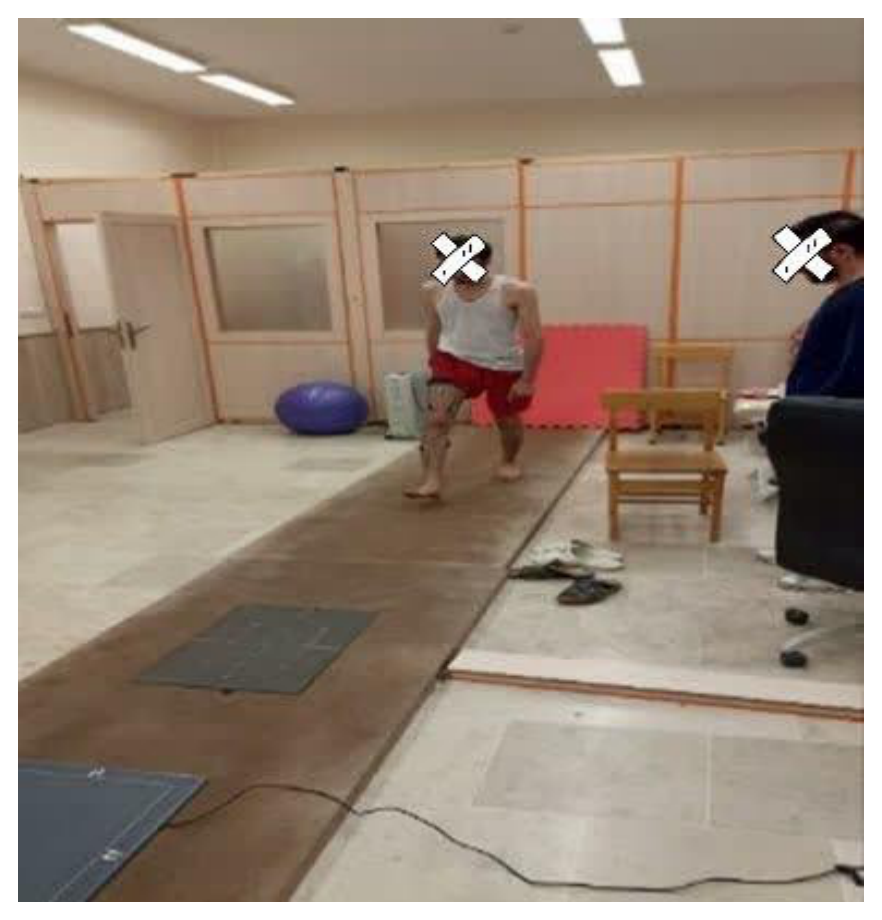
The experimental protocol began with a five-minute warm-up consisting of stretching and walking. Participants were then familiarized with an 18-m overground walkway equipped with a Footscan system embedded at its midpoint. Participants were instructed to walk barefoot along the walkway at a constant speed of approximately 1.1 m/s, ensuring that their dominant foot landed in the center of the Footscan platform (40) (Fig. 1). Walking speed was controlled during both the pretest and posttest assessments by measuring the time required to cover the specified distance using a stopwatch. Several familiarization trials were conducted to allow participants to become accustomed to the required walking speed and foot placement on the Footscan platform. Following familiarization, participants completed four walking trials during which plantar pressure and corresponding forces were recorded across ten regions of the foot. Trials were repeated if the participant failed to place the entire dominant foot within the boundaries of the Footscan platform, altered their natural walking pattern to target the platform, or walked at a speed that deviated by more than 10% from the target speed.
Data Collection and Analysis
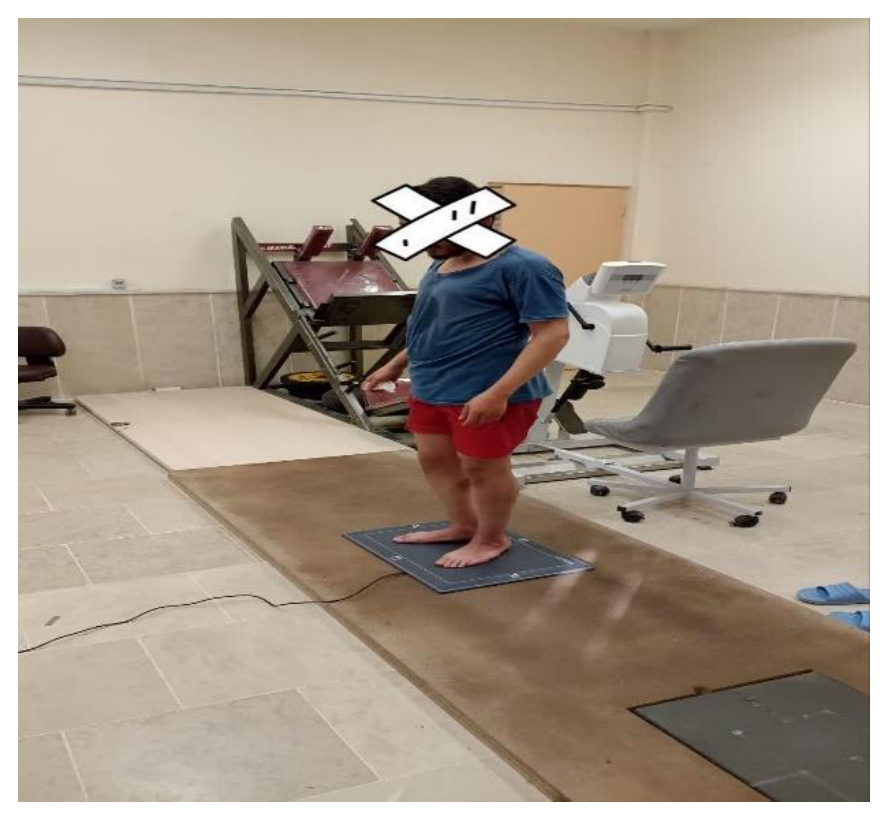
Body weight was measured using a force platform, and height was measured using a stadiometer to calculate body mass index (BMI). A treadmill equipped with a data recording system and a wireless heart rate monitor was used to induce and monitor fatigue. Plantar pressure variables and center of pressure (CoP) displacement during walking were measured using a Footscan system (RSscan International, Belgium; 578 × 418 × 12 mm; 4,096 sensors) operating at a sampling frequency of 253 Hz. Participants stood still on the platform for 5 seconds, during which data were recorded and averaged (Fig. 2). The device software automatically divided the foot into ten anatomical regions: the medial heel, lateral heel, midfoot, first to fifth metatarsals (M1–M5), hallux (T1), and second to fifth toes (T2–T5) (41). The mean values obtained from four trials were considered the pretest measurements. Following the running-induced fatigue protocol, posttest measurements were collected using the same procedure. The effects of fatigue (within-subject factor), group (between-subject factor), and their interaction (fatigue × group) were examined across the four groups. The biomechanical variables analyzed included peak plantar pressure and force distribution across the ten foot regions: hallux (T1), second to fifth toes (T2–T5), first to fifth metatarsals (M1–M5), midfoot, medial heel, and lateral heel.
Table 1. Demographic characteristics of participants in the four different groups under study (Mean ± standard deviation).
* Note: Data are reported as (mean ± SD). Significant differences are indicated by an asterisk (p < 0.05).
Fatigue Protocol
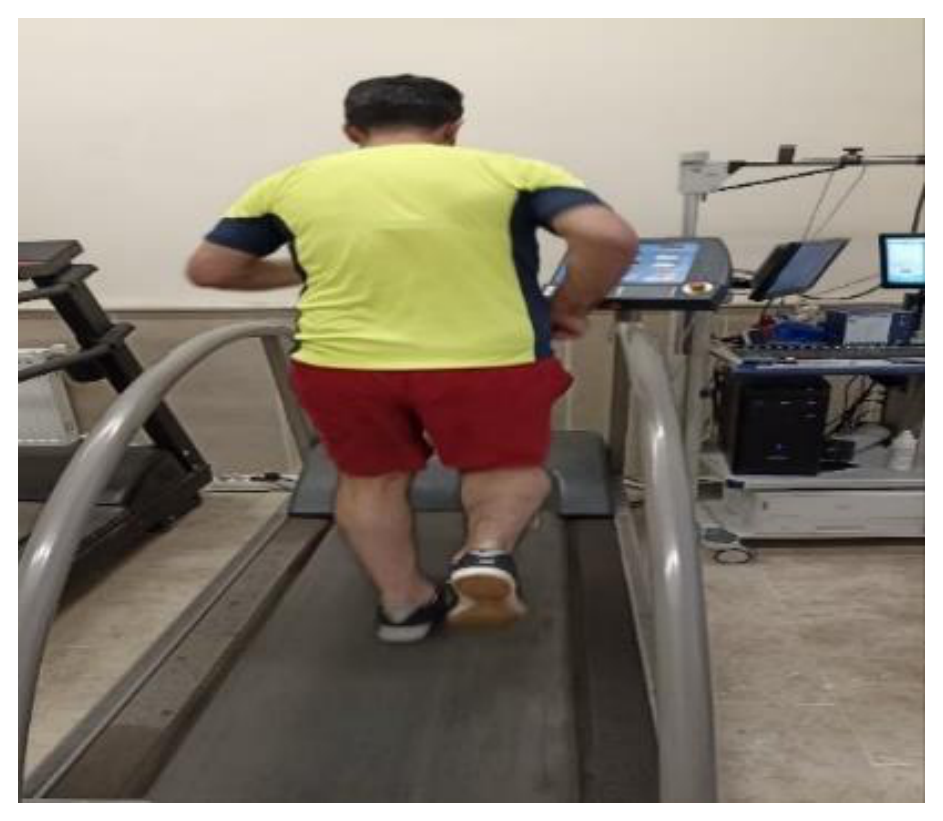
A running-induced fatigue protocol was performed on a treadmill for each participant (Fig. 3). Before testing, participants were familiarized with the Borg Rating of Perceived Exertion (RPE) scale, ranging from 6 (no exertion) to 20 (maximal exertion). The initial treadmill speed was set at 6 km/h and increased by 1 km/h every minute. Participants reported their perceived exertion at the end of each stage using the 6–20 Borg scale (42). Once an RPE of 13 was reached, the treadmill speed was maintained, and participants continued running at that speed. The test was terminated two minutes after participants reported an RPE of 17 or when they reached 80% of their maximum heart rate (43).
Fig. 1. 1Execution of the walking test protocol )before and after the fatigue protocol(
Fig. 2. Subject standing on the foot scanner for foot scanning
Fig. 3. Running induced fatigue protocol
Statistical Analyses
Data normality was assessed using the Shapiro–Wilk test, and homogeneity of variances was evaluated using Levene's test (P > 0.05). A two-way repeated-measures analysis of variance (ANOVA) was used to examine the effects of fatigue, group, and their interaction. Bonferroni correction was applied for multiple comparisons. Effect sizes were estimated using eta squared (η²), with values of 0.01–0.06, 0.06–0.14, and ≥0.14 interpreted as small, moderate, and large effects, respectively. Statistical significance was set at P < 0.05. All analyses were performed using SPSS version 28.
Results
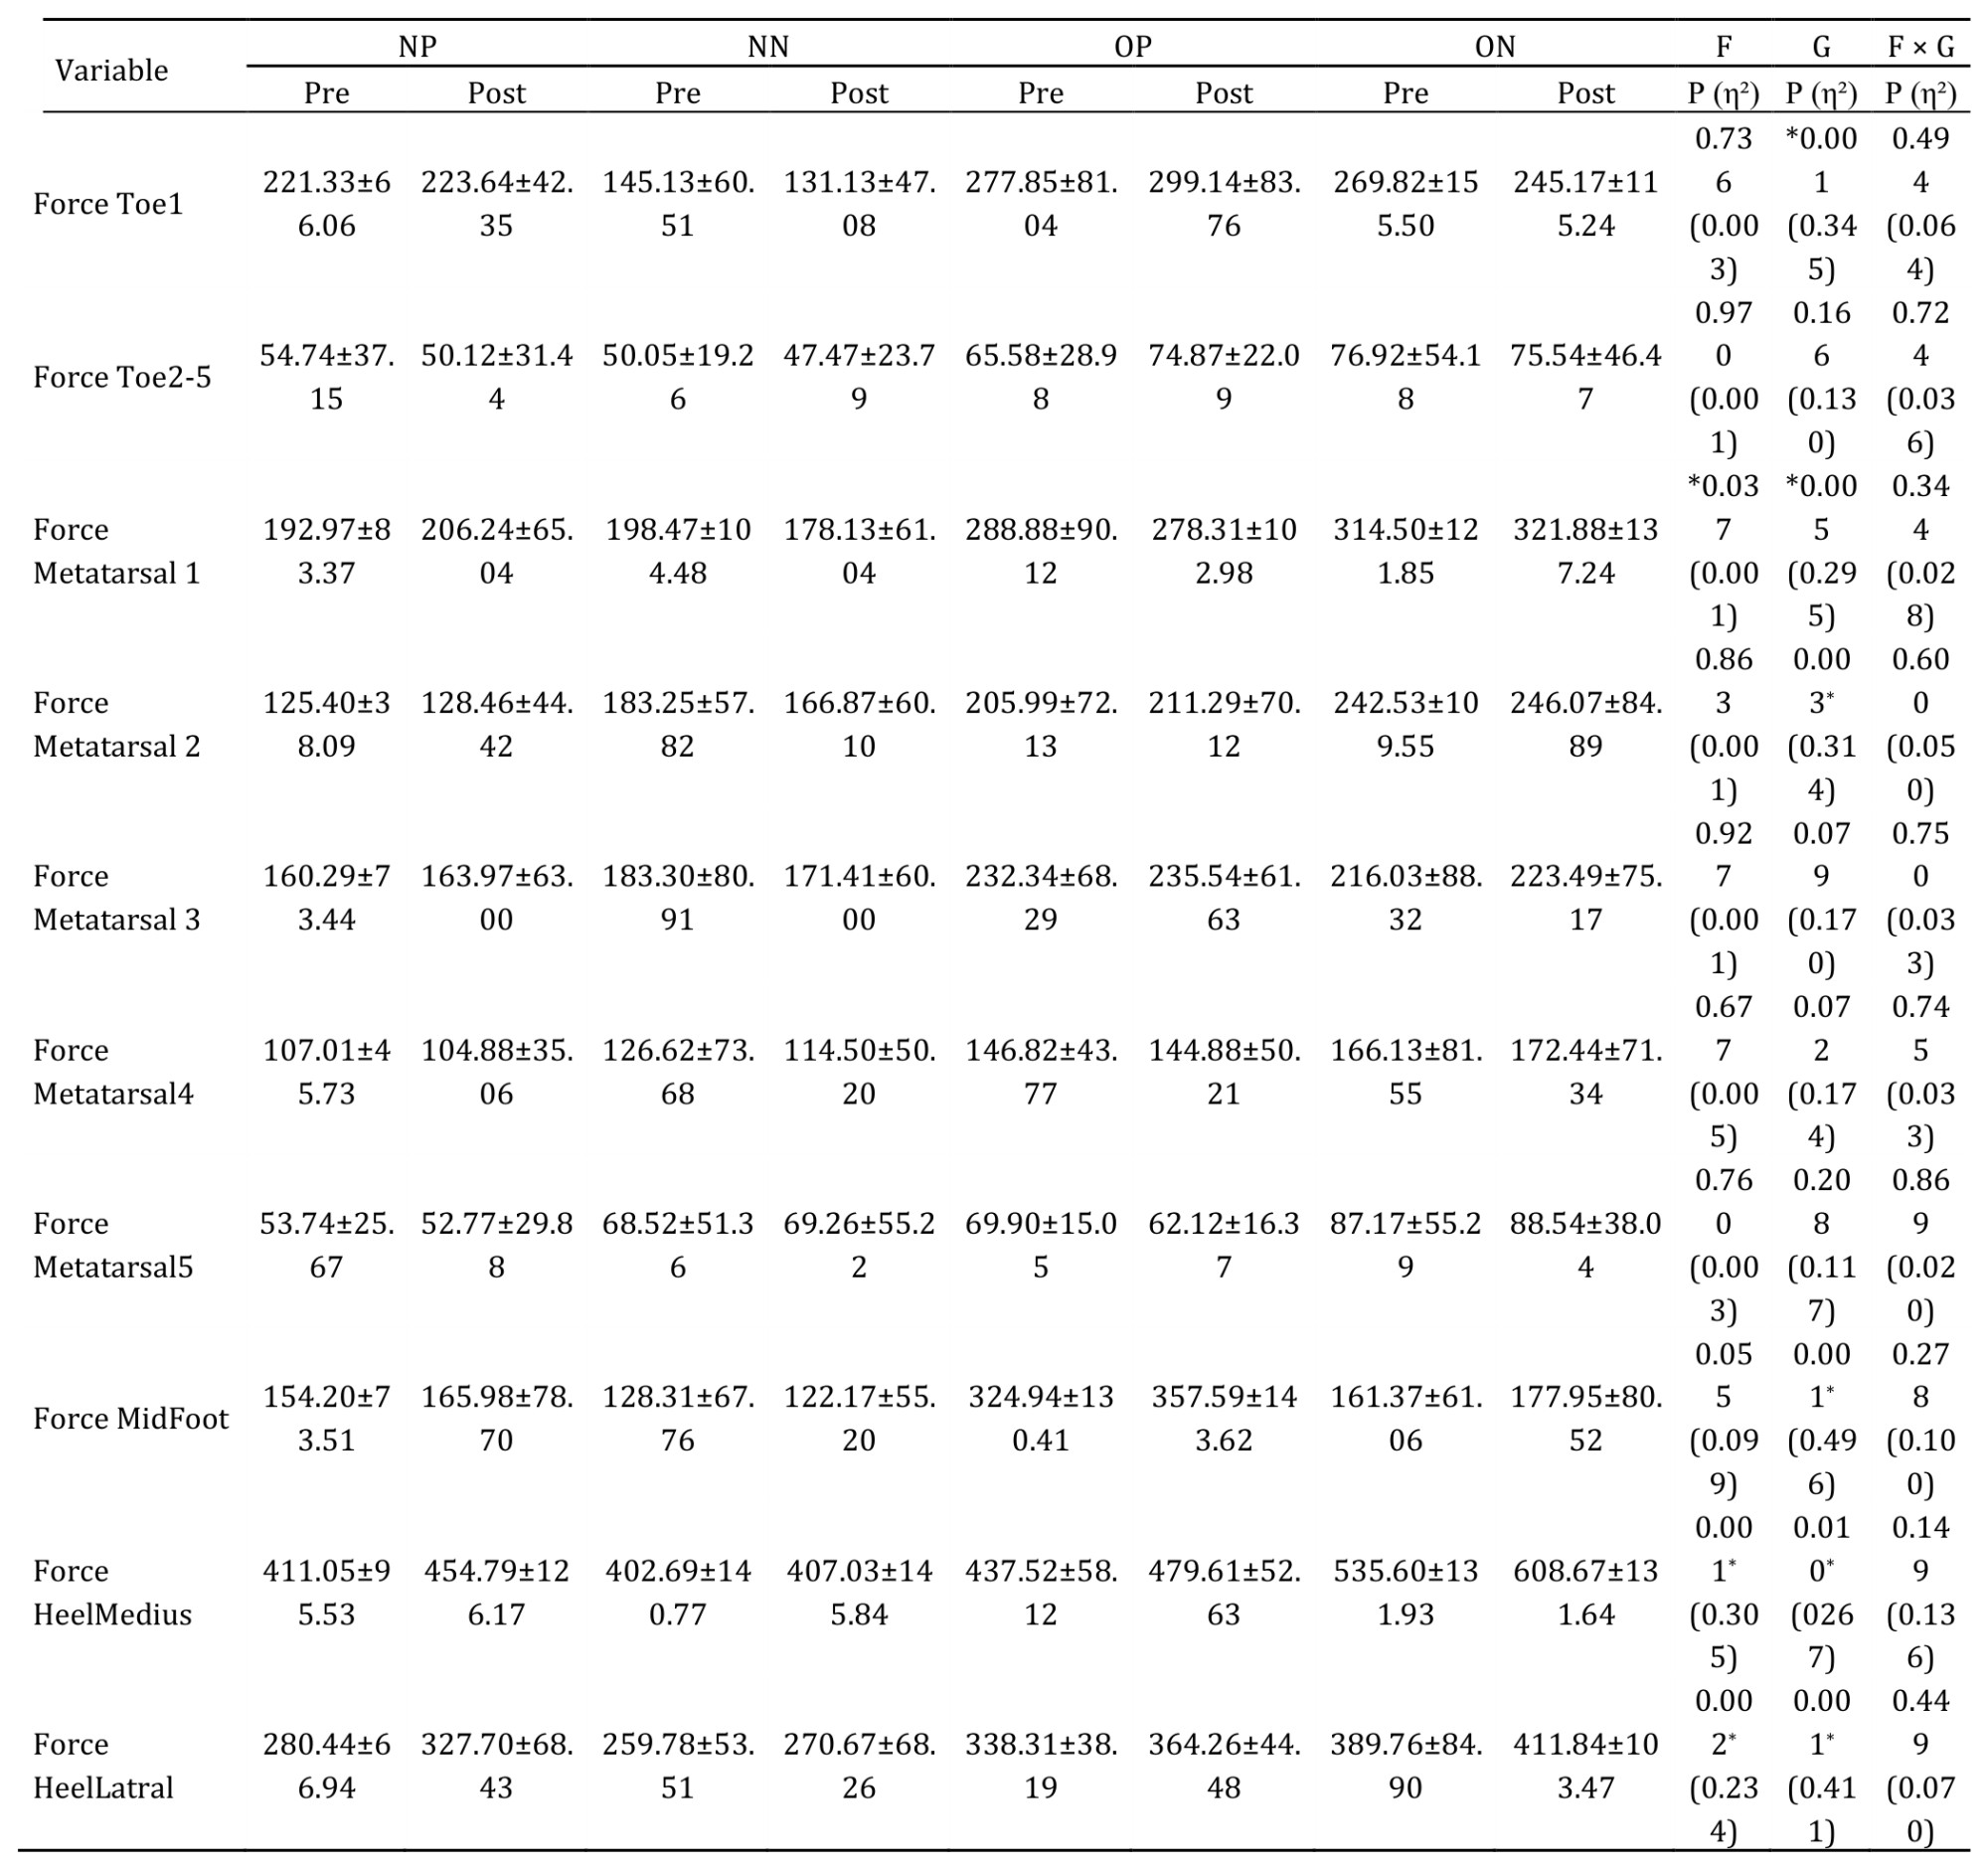
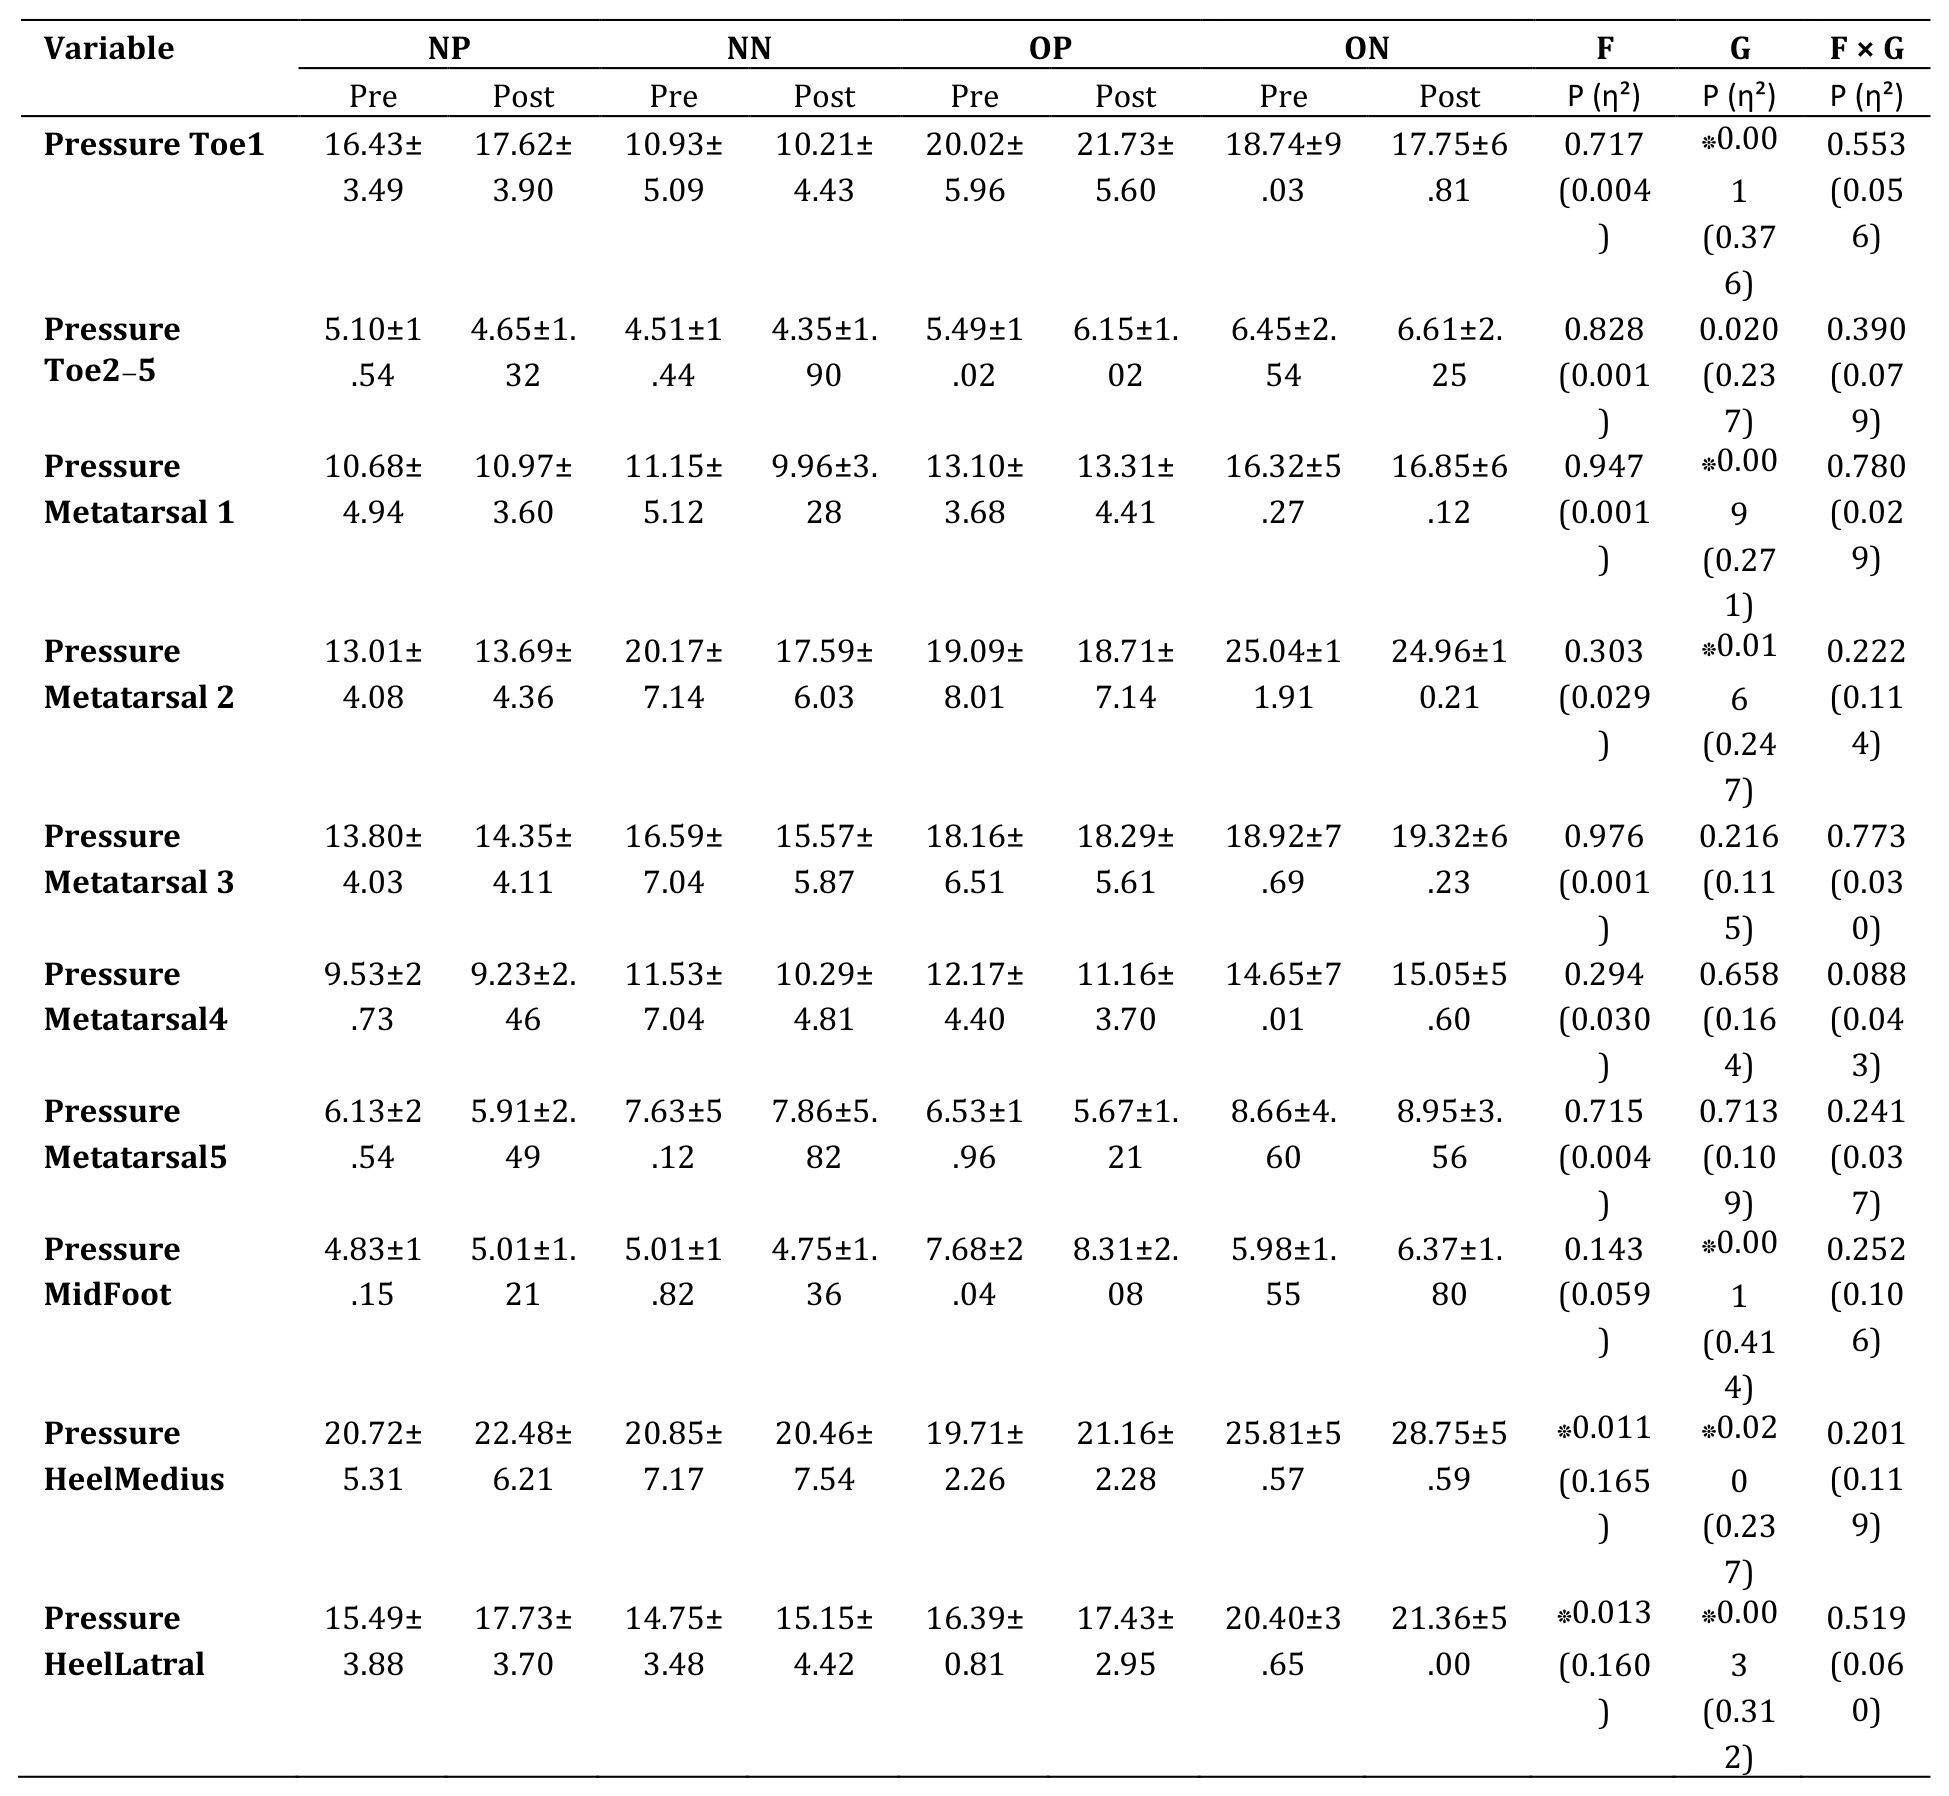
The demographic characteristics of the participants are presented in Table 1. The results revealed a significant main effect of fatigue on plantar force in the first metatarsal (P < 0.037), medial heel (P < 0.001), and lateral heel (P < 0.002) regions. Pairwise comparisons showed that plantar force in the first metatarsal region decreased significantly following fatigue, whereas force in the medial and lateral heel regions increased significantly. Significant main effects of group were observed for plantar force in the hallux (P < 0.001), first metatarsal (P < 0.005), second metatarsal (P < 0.003), midfoot (P < 0.001), medial heel (P < 0.010), and lateral heel (P < 0.001) regions. Pairwise comparisons indicated that the overweight group with pronated feet exhibited greater midfoot force than the other groups. Furthermore, the overweight group with normal foot posture showed greater force in the first and second metatarsal regions than the other groups (Table 2). As shown in Table 3, a significant main effect of fatigue was observed for plantar pressure in the medial heel (P < 0.011) and lateral heel (P < 0.013) regions. Significant main effects of group were also found for plantar pressure in the hallux (P < 0.001), second to fifth toes (P < 0.020), first metatarsal (P < 0.009), second metatarsal (P < 0.016), midfoot (P < 0.001), medial heel (P < 0.020), and lateral heel (P < 0.003) regions. No significant fatigue × group interaction effects were observed for plantar pressure variables (P > 0.05).
Table 2. Mean and Standard Deviation of Plantar Forces During Walking Among four Groups before and after the fatigue protocol.
Note: Values are presented as mean ± SD. NP, normal weight with pronated feet; NN, normal weight with normal feet; OP, overweight with pronated feet; ON, overweight with normal feet; Pre, pre-fatigue; Post, post-fatigue; T1, hallux; T2–5, second to fifth toes; M1–M5, first to fifth metatarsals; MF, midfoot; MH, medial heel; LH, lateral heel; F, main effect of fatigue; G, main effect of group; F × G, fatigue-by-group interaction; P, statistical significance; η², eta squared. *P < 0.05.
Table 3. Mean and Standard Deviation of Plantar Pressures During Walking Among four Groups before and after the fatigue protocol.
Note: Values are presented as mean ± SD. NP, normal weight with pronated feet; NN, normal weight with normal feet; OP, overweight with pronated feet; ON, overweight with normal feet; Pre, pre-fatigue; Post, post-fatigue; T1, hallux; T2–5, second to fifth toes; M1–M5, first to fifth metatarsals; MF, midfoot; MH, medial heel; LH, lateral heel; F, main effect of fatigue; G, main effect of group; F × G, fatigue-by-group interaction; P, statistical significance; η², eta squared. *P < 0.05.
Discussion
The findings indicated that the applied force in the first metatarsal region after fatigue was lower compared to before fatigue during walking. These findings are consistent with the results of Garcia-Perez et al., who found that treadmill running increased ground contact and reduced peak pressure in the heel, metatarsus, and hallux. It also decreased stride frequency, decreased peak pressure in the lateral heel and hallux, and increased relative load in the medial arch (44). Moreover, the force values in the medial and lateral heel regions after fatigue were significantly greater than before fatigue. Muscle fatigue of the foot and ankle muscles during walking is associated with changes in foot roll-over and ankle movement kinematics (45) that will lead to sub-optimal running mechanics (46). Indeed, it has been observed that foot muscle fatigue shifted the dynamic plantar pressure to the medial forefoot (47), reflecting excessive pronation. However, our results showed that running induced fatigue shifted the dynamic plantar forces to the heel regions. These results are consistent with the findings of William et al. and Abdollahi et al. who reported that loading on the medial heel increases after fatigue (48, 49).
Findings showed that the force values in the midfoot region for the overweight group with a pronated foot were greater compared to other groups. When compared to normal-weight individuals they also had increased values of plantar pressure, midfoot and second head metatarsal head plantar pressures (50). The differences in plantar pressure distribution, therefore, may be related to mechanical repercussions of movement pattern changes due to fatigue. In fatigue conditions, reduced muscular control of the foot–shank joints may impair the ability to dynamically resist eversion or inversion (51). The authors noticed that overweight indiviuals with a pronated foot seemed to flatten the midfoot during walking. In obese and overweight people, perhaps more important than the development of muscle fatigue is how their high body mass has been reported to affect plantar pressure and force pattern (52), walking strategies (53), and foot posture (54), such that they were at a higher risk of foot discomfort and/or pathologies than normal-weight people (17). A previous study demonsted that overweight subjects had diminished foot sensitivity and a similar sensitivity in certain foot areas in comparison to gender, age and height-matched normal-weight subjects (55). The conclusions suggested that due to an increased plantar pressure and reduced foot sensitivity, obese individuals are predisposed to a higher risk of foot injury, with limitation in activity performance (55). Our observation of significant differences in plantar loading characteristics between obese and non-obese participants is consistent with previous research that has identified higher peak pressures under the feet of obese individuals (6). Wilson and Krnozek (56) reported that fatigue leads runners to modify their running mechanics, accompanied by changes in the loading patterns of the plantar surface. Fourchet et al. (46) demonstrated that fatigue is associated with increased loading beneath the medial arch. The elevated patterns of foot loading at the midfoot in obese participants observed in this study suggest that there is increased ground contact of the midfoot during walking, which could also be related to excessive adipose tissue in the medial arch. Wearing et al. (57) suggest that fat mass, rather than changes in foot structure, may be the cause of increased midfoot plantar pressures and the outward appearance of a ‘flat’ foot in obese individuals. Increased body mass is known to contribute to elevated peak plantar pressures and elevated peak plantar pressures are associated with foot pain (58). Change in body mass was not significantly associated with change in foot pain intensity, but there were significant, positive correlations between change in foot pain intensity and change in both heel and midfoot peak pressure. This is consistent with the findings of Anbarian and Esmaili, who studied the effect of running fatigue on the roll-over pattern of beginner runners, indicating increased pressure on the anterior and medial parts of the foot (59). But these results are inconsistent with the findings of Bizio and Muretto that peak pressure decreases in the heel and midfoot regions. Bizio Muretto attributes this pressure change to the shift of the center of pressure toward the forefoot after fatigue (60).
Results indicated that the peak pressure values in the first and second metatarsal regions for the overweight group with a normal foot were greater compared to other groups. However, no studies have analyzed foot structure and its changes in function in obese individuals. The feet are constantly exposed to weight-bearing strains in obese individuals during normal gait, the weight in the feet is approximately 1.2 times the body weight (61). In obese individuals, weight bearing on the medial longitudinal arch is approximately 3 times greater than it is in normal weight individuals (57), which can cause negative biodynamic changes that may potentially decrease the quality of life, and restrict physical activity (62). In a prospective investigation, Teijs et al. (63) examined factors related to patellofemoral pain and identified greater loading beneath the second and third metatarsals as a significant contributing factor (63). Therefore, running-induced fatigue may increase the susceptibility of novice runners with low arches to patellofemoral pain. Excessive heel striking has also been identified as one of the contributing factors to patellofemoral pain (64). Greater pressure and loading in the medial forefoot are indicative of increased heel-strike loading (65) and may consequently represent a risk factor for patellofemoral pain among novice runners with low arches.
Furthermore, decreased physical activity can lead to weakened muscle strength due to restricted motion (66). Excessive weight-bearing on feet due to obesity causes abnormal structural and functional changes in the foot. Furthermore, it results in decreased physical activity and weakened muscles, and leads to a series of unfortunate symptoms. These complications may increase socioeconomic costs related to obesity, and hence, preventing obesity is important. Wiest et al. (47) demonstrated that fatigue results in increased peak force, peak pressure, and momentum within the second and third metatarsal and midfoot regions (47). They proposed that these alterations in the rolling pattern of the foot may be useful in identifying metatarsal stress fractures associated with fatigue (47). According to Elliott and Ackland (67), alterations in foot mechanics during running can substantially influence running mechanics and overall performance (67). Accordingly, the observed mechanical changes may reflect a deterioration in optimal running biomechanics. Such suboptimal biomechanical patterns have also been recognized as contributing factors to the development of running-related injuries (68).
Recent studies on flat feet showed the importance of investigating the pathophysiology of plantar fasciitis and abnormalities of the feet in obese female adults (69). Obesity is a risk factor for plantar fasciitis (70), and a mean plantar fascia thickness of 4.8 mm has been reported in patients with plantar fasciitis (71). However, the mean plantar fascia thickness of obese patients in this study was 4.2 mm, which is 0.6 mm less than the mean thickness observed in patients with plantar fasciitis. Obese and overweight patients have a higher mean plantar pressure than normal weight individuals (72). Previous studies have reported increased plantar pressure on the heel and second and fourth metatarsal bones in male participants with a BMI of ≥ 25 kg/m2 (57). In a prospective study, Willems et al. (65) demonstrated that a concentration of loading on the medial side of the foot during running represents a risk factor for ankle sprains among young male and female physical education students. Previous findings have likewise indicated that transferring load toward the medial aspect of the foot is associated with an increased risk of ankle sprain injuries (73). The accumulation and concentration of plantar loading along the medial region of the foot may further increase the likelihood of ankle sprains (74). Greater pressure and impact beneath the first metatarsal region have also been identified as potential risk factors for ankle sprains (65). Furthermore, increased metatarsal loading has been associated with the occurrence of metatarsal stress fractures (75). Thus, greater loading beneath the first, second, and third metatarsals during fatigue may correspond to an elevated risk of metatarsal stress fractures. Overall, running-induced fatigue may increase the risk of patellofemoral pain, ankle sprains, and metatarsal stress fractures among runners with low arches.
The group effect was statistically significant for the peak pressure at the first toe, the second to fifth toes, the first metatarsal bone, the second metatarsal bone, the midfoot region, the medial heel, and the lateral heel regions. These variations can determine the overloading of the lower limbs, clinically expressed by pain and discomfort (76). Because of higher peak pressures under lateral forefoot, midfoot and rearfoot while jogging in comparison to fast running, jogging may cause foot problems (77). Hamzawi and Esmaili (2021) reported that in the heel strike group, after fatigue, the pressure on the medial and lateral parts of the heel, the first metatarsal, and the big toe increased; also, the medial-lateral force ratio decreased in some phases. In the forefoot strike group, after fatigue, the pressure on the first to third metatarsals increased and the pressure on the fifth metatarsal decreased; the medial-lateral force ratio increased in certain phases. In both groups, the contact time after fatigue increased. Finally, they concluded that: fatigue has different effects on pressure distribution that depend on the type of foot strike, that is, the adaptive strategy of the foot with strike is different (78). Overweight individuals with reduced daily physical activity generate higher plantar pressures at forefoot and midfoot when compared to their normal-weight counterparts and those overweight with increased physical activity (79). The dynamic distribution of plantar pressure raises, with a maximum at forefoot (2nd–5th metatarsi) and midfoot (especially the medial part) (80). The evaluation of static plantar pressure shows that overweight and obese individuals generate higher forces on a higher foot area and increased plantar pressures when compared to their normal-weight counterparts, especially for the midfoot and under the heads of 2nd–5th metatarsi (81).
Additionally, the findings showed no significant differences for the interaction effect of fatigue and group. Therefore, given that the effect of group and fatigue variables was not significant in most of the variables of the present study, it should be considered that the response of different groups to the fatigue protocol was almost similar. These observations are inconsistant to those of the study of Mesquita et al. (76). that concluded that in obese individuals the plantar pressure distribution during running was modified. The results of this study showed that while running the obese individuals generated more forces when compared with those with lower weight. BMI was positively correlated with peak pressure for the whole foot, midfoot and forefoot. They had a larger contact area under all foot areas. Thereby, this study highlights that obesity is associated with the increase of plantar pressure during running with self-selected speeds (speeds identified as the average walking/running speed of five overground trials on a 10 m route (82). Moreover, it issued the hypothesis that obese individuals have a higher risk of developing foot discomfort and pain.
The physiological effects of fatigue on the activation and efficiency of the muscle mechanism lead to gait pattern disturbances. Hauswirt et al. (83) reported that both stride length and stride frequency undergo changes toward the end of prolonged running. Mizrahi et al. (84) also found that, during treadmill running at a constant speed, stride velocity decreases as running-induced fatigue becomes more pronounced. From a mechanical standpoint, alterations in the gait pattern inevitably result in corresponding changes in ground reaction forces. There are limitations in this study, including the limited number of subjects, the lack of recording of kinematic variables in 3D, and the use of barefoot walking, so the results of this study cannot be generalized to walking with shoes. Therefore, it is suggested that these issues be investigated in future studies. given that the dependent variables of plantar pressure and force were high in different areas of the foot and there is a possibility of increased type I error, the results of the present study should be interpreted with caution. In addition, electromyographic muscle activity was not assessed. Recording electromyographic activity can help to better interpret neuromuscular adaptations and provide a clearer explanation for pressure-related changes.
Conclusion
The findings of this study suggest that running-induced fatigue may alter plantar force and pressure distribution during walking. Following fatigue, plantar loading appeared to shift from certain forefoot regions toward the heel, potentially reflecting changes in neuromuscular control. Furthermore, overweight individuals, particularly those with pronated feet, exhibited greater plantar loading in certain regions, especially the midfoot. These findings suggest that body weight status and foot posture may influence plantar loading patterns. However, the absence of significant fatigue × group interaction effects for plantar pressure variables suggests that the groups responded similarly to the fatigue protocol in terms of plantar pressure distribution. Future studies incorporating lower-limb kinematics and muscle activity measurements are recommended to better understand the mechanisms underlying these changes.
Acknowledgements
This article is the result of the thesis of Hossein Farzollahi, a master's student at the University of Mohaghegh Ardabili. The authors sincerely thank the participants in this study for their voluntary participation.
Ethical Considerations
Compliance with ethical guidelines
All ethical principles were observed throughout the study. Participants were fully informed about the study objectives and procedures, and written informed consent was obtained from all participants before enrollment. Participation was voluntary, and participants were informed of their right to withdraw from the study at any stage without penalty. The confidentiality of personal information was maintained, and appropriate measures were taken to minimize potential physical or psychological harm. The study was conducted in accordance with the ethical principles of the Declaration of Helsinki. The research protocol was approved by the Research Ethics Committee of the University of Mohaghegh Ardabili, Iran (Ethics Code: IR.UMA.REC.1402.011).
Funding
This study did not receive any specific funding from government, commercial, or non-profit organizations.
Author's contributions
HF contributed to the study design, data analysis, manuscript drafting, and critical revision of the manuscript. AJ and AM contributed to the study design, data collection, and data analysis. All authors read and approved the final version of the manuscript.
Conflicts of interest
The authors declare no conflict of interest.
Type of Study: Research |
Subject:
Special
Received: 2026/08/19 | Accepted: 2026/10/17 | Published: 2026/10/20
Received: 2026/08/19 | Accepted: 2026/10/17 | Published: 2026/10/20
References
1. Catan L, Amaricai E, Onofrei RR, Popoiu CM, Iacob ER, Stanciulescu CM, et al. The impact of overweight and obesity on plantar pressure in children and adolescents: a systematic review. International Journal of Environmental Research and Public Health. 2020;17(18):6600. [DOI:10.3390/ijerph17186600]
2. Thomas D, Elliott EJ. Low glycaemic index, or low glycaemic load, diets for diabetes mellitus. Cochrane Database of Systematic Reviews. 2009;(1):CD006296. [DOI:10.1002/14651858.CD006296.pub2]
3. Anandacoomarasamy A, Caterson I, Sambrook P, Fransen M, March L. The impact of obesity on the musculoskeletal system. International Journal of Obesity. 2008;32(2):211-222. [DOI:10.1038/sj.ijo.0803715]
4. Piri E, Jafarnezhadgero AA. A review of running mechanics in obese or overweight individuals. Journal of Sport Biomechanics. 2023;9(1):16-31. [DOI:10.61186/JSportBiomech.9.1.16]
5. Butterworth PA, Landorf KB, Smith S, Menz HB. The association between body mass index and musculoskeletal foot disorders: a systematic review. Obesity Reviews. 2012;13(7):630-642. [DOI:10.1111/j.1467-789X.2012.00996.x]
6. Hills A, Hennig E, McDonald M, Bar-Or O. Plantar pressure differences between obese and non-obese adults: a biomechanical analysis. International Journal of Obesity. 2001;25(11):1674-1679. [DOI:10.1038/sj.ijo.0801785]
7. Menz HB, Morris ME. Clinical determinants of plantar forces and pressures during walking in older people. Gait & Posture. 2006;24(2):229-236. [DOI:10.1016/j.gaitpost.2005.09.002]
8. Jafarnezhadgero A, Fatollahi A, Amirzadeh N, Siahkouhian M, Granacher U. Ground reaction forces and muscle activity while walking on sand versus stable ground in individuals with pronated feet compared with healthy controls. PLOS ONE. 2019;14(9):e0223219. [DOI:10.1371/journal.pone.0223219]
9. Koreili Z, Fatahi A, Azarbaijany MA, Sharifnezhad A. Comparison of static balance performance and plantar selected parameters of dominant and non-dominant leg in active adolescent's female with ankle pronation. The Scientific Journal of Rehabilitation Medicine. 2023;12(2):306-319. [DOI:10.32598/SJRM.12.2.7]
10. Valizade-Orang A, Siahkoohian M, Jafarnezhadgero A, Bolboli L, Ghorbanlou F. Investigating the effects of long-term use of motion control shoes on the frequency spectrum of ground reaction force during running in the runners with pronated feet. The Scientific Journal of Rehabilitation Medicine. 2019;8(4):123-131.
11. Hertling D, Kessler RM. Management of Common Musculoskeletal Disorders. Philadelphia: Lippincott Williams & Wilkins; 2014.
12. Telfer S, Bigham J. The influence of population characteristics and measurement system on barefoot plantar pressures: a systematic review and meta-regression analysis. Gait & Posture. 2019;67:269-276. [DOI:10.1016/j.gaitpost.2018.10.030]
13. Buldt AK, Allan JJ, Landorf KB, Menz HB. The relationship between foot posture and plantar pressure during walking in adults: a systematic review. Gait & Posture. 2018;62:56-67. [DOI:10.1016/j.gaitpost.2018.02.026]
14. Jafarnezhadgero A, Ghorbanloo F, Malekabadi AM, Ghasemi S. The acute effect of knee brace on the electromyography activity of lower limb muscles in individuals with genu valgus during walking. Medical Journal of Tabriz University of Medical Sciences. 2021;43(1):116-123. [DOI:10.34172/mj.2021.036]
15. Franco PS, Moro CF, Figueiredo MM, Azevedo RR, Ceccon FG, Carpes FP. Within and between-days repeatability and variability of plantar pressure measurement during walking in children, adults and older adults. Advances in Rheumatology. 2018;58:15. [DOI:10.1186/s42358-018-0014-z]
16. Štefan L, Kasović M, Zvonar M. Association between the levels of physical activity and plantar pressure in 6-14-year-old children. PeerJ. 2020;8:e8551. [DOI:10.7717/peerj.8551]
17. Walsh TP, Butterworth PA, Urquhart DM, Cicuttini FM, Landorf KB, Wluka AE, et al. Increase in body weight over a two-year period is associated with an increase in midfoot pressure and foot pain. Journal of Foot and Ankle Research. 2017;10(1):31. [DOI:10.1186/s13047-017-0214-5]
18. Neri SGR, Gadelha AB, Correia ALM, Pereira JC, de David AC, Lima RM. Obesity is associated with altered plantar pressure distribution in older women. Journal of Applied Biomechanics. 2017;33(5):323-329. [DOI:10.1123/jab.2016-0357]
19. Naderi A, Baloochi R, Rostami KD, Fourchet F, Degens H. Obesity and foot muscle strength are associated with high dynamic plantar pressure during running. The Foot. 2020;44:101683. [DOI:10.1016/j.foot.2020.101683]
20. Behrens M, Gube M, Chaabene H, Prieske O, Zenon A, Broscheid KC, et al. Fatigue and human performance: an updated framework. Sports Medicine. 2023;53(1):7-31. [DOI:10.1007/s40279-022-01748-2]
21. Liu Z, Yang C, Yu J, Zhao X, Wu J, Zhang Y, et al. The effect of muscles fatigue on the knee's kinetics and kinematics characteristics. Sustainability. 2023;15(4):3029. [DOI:10.3390/su15043029]
22. Farrokhi Parashkoh M, Amirseyfaddini M, Naderi S. Effects of Fatigue on Lower-Limb Coordination and Its Variability During Running in Semi-Professional Soccer Players. 2026;12(1):2-18. [DOI:10.61882/JSportBiomech.12.1.2]
23. Jones DA. Muscle fatigue due to changes beyond the neuromuscular junction. In: Porter R, Whelan J, editors. Human Muscle Fatigue: Physiological Mechanisms. Ciba Foundation Symposium 82. London: Pitman Medical; 1981. p. 178-196. [DOI:10.1002/9780470715420.ch11]
24. Gerlach KE, White SC, Burton HW, Dorn JM, Leddy JJ, Horvath PJ. Kinetic changes with fatigue and relationship to injury in female runners. Medicine & Science in Sports & Exercise. 2005;37(4):657-663. [DOI:10.1249/01.MSS.0000158994.29358.71]
25. Dempster J, Dutheil F, Ugbolue UC. The prevalence of lower extremity injuries in running and associated risk factors: a systematic review. Physical Activity and Health. 2021;5(1):133-145. [DOI:10.5334/paah.109]
26. Clansey AC, Hanlon M, Wallace ES, Lake MJ. Effects of fatigue on running mechanics associated with tibial stress fracture risk. Medicine & Science in Sports & Exercise. 2012;44(10):1917-1923. [DOI:10.1249/MSS.0b013e318259480d]
27. Headlee DL, Leonard JL, Hart JM, Ingersoll CD, Hertel J. Fatigue of the plantar intrinsic foot muscles increases navicular drop. Journal of Electromyography and Kinesiology. 2008;18(3):420-425. [DOI:10.1016/j.jelekin.2006.11.004]
28. Malekabadi AM, Jafarnezhadgero A. The acute effect of using of texture foot orthoses on ground reaction forces in older adults during walking. Medical Journal of Tabriz University of Medical Sciences. 2021;42(6):756-763. [DOI:10.34172/mj.2021.017]
29. Enoka RM, Duchateau J. Muscle fatigue: what, why and how it influences muscle function. The Journal of Physiology. 2008;586(1):11-23. [DOI:10.1113/jphysiol.2007.139477]
30. Balakrishnan A, Medikonda J, Namboothiri PK. Analysis of the effect of muscle fatigue on gait characteristics using data acquired by wearable sensors. In: 2020 IEEE International Conference on Distributed Computing, VLSI, Electrical Circuits and Robotics (DISCOVER). IEEE; 2020. p. 137-140. [DOI:10.1109/DISCOVER50404.2020.9278096]
31. Lee CR, Kim MK, Cho MS. The relationship between balance and foot pressure in fatigue of the plantar intrinsic foot muscles of adults with flexible flatfoot. Journal of Physical Therapy Science. 2012;24(8):699-701. [DOI:10.1589/jpts.24.699]
32. Bartaguiz E, Dindorf C, Dully J, Becker S, Fröhlich M. Effects of increasing physical load and fatigue on the biomechanics of elite cyclists. Scientific Journal of Sport and Performance. 2023;2(1):59-69. [DOI:10.55860/NBMD9425]
33. Saburi L, Piri E. The effect of different types of training interventions on walking and running mechanics in people with foot pronation: a systematic review. Journal of Sport Biomechanics. 2026;12(2):242-263. [DOI:10.66224/JSportBiomech.12.2.242]
34. Jiang X, Sárosi J, Bíró I. Characteristics of lower limb running-related injuries in trail runners: a systematic review. Physical Activity and Health. 2024;8(1):137-147. [DOI:10.5334/paah.375]
35. Wang H, Frame J, Ozimek E, Leib D, Dugan EL. The effects of load carriage and muscle fatigue on lower-extremity joint mechanics. Research Quarterly for Exercise and Sport. 2013;84(3):305-312. [DOI:10.1080/02701367.2013.814097]
36. Brody DM. Techniques in the evaluation and treatment of the injured runner. Orthopedic Clinics of North America. 1982;13(3):541-558. [DOI:10.1016/S0030-5898(20)30252-2]
37. McPoil TG, Cornwall MW. Relationship between three static angles of the rearfoot and the pattern of rearfoot motion during walking. Journal of Orthopaedic & Sports Physical Therapy. 1996;23(6):370-375. [DOI:10.2519/jospt.1996.23.6.370]
38. Gijon-Nogueron G, Sanchez-Rodriguez R, Lopezosa-Reca E, Cervera-Marin JA, Martinez-Quintana R, Martinez-Nova A. Normal values of the Foot Posture Index in a young adult Spanish population: a cross-sectional study. Journal of the American Podiatric Medical Association. 2015;105(1):42-46. [DOI:10.7547/8750-7315-105.1.42]
39. Wang Y, Guo X, Liu L, Xie M, Lam WK. Effects of Tai-chi and running exercises on cardiorespiratory fitness and biomarkers in sedentary middle-aged males: a 24-week supervised training study. Biology. 2022;11(3):375. [DOI:10.3390/biology11030375]
40. Jafarnezhadgero AA, Sorkhe E, Oliveira AS. Motion-control shoes help maintaining low loading rate levels during fatiguing running in pronated female runners. Gait & Posture. 2019;73:65-70. [DOI:10.1016/j.gaitpost.2019.07.133]
41. Farzaneh Herabad N, Anbarian M, Rahbar S. The effects of foot structures on plantar pressure characteristics in overweight girls aged 10-13 years during walking. Journal of Paramedical Sciences & Rehabilitation. 2024;12(4):14-25.
42. Williams N. The Borg rating of perceived exertion (RPE) scale. Occupational Medicine. 2017;67(5):404-405. [DOI:10.1093/occmed/kqx063]
43. Camic CL, Hahn CJ, Hendrickson BC, Jagim AR. Validation of the physical working capacity at the fatigue threshold treadmill test. Kinesiology. 2017;49(2):146-152. [DOI:10.26582/k.49.2.13]
44. García-Pérez JA, Pérez-Soriano P, Llana S, Martínez-Nova A, Sánchez-Zuriaga D. Effect of overground vs treadmill running on plantar pressure: influence of fatigue. Gait & Posture. 2013;38(4):929-933. [DOI:10.1016/j.gaitpost.2013.04.026]
45. Debenham J, Travers M, Gibson W, Campbell A, Allison G. Eccentric fatigue modulates stretch-shortening cycle effectiveness: a possible role in lower limb overuse injuries. International Journal of Sports Medicine. 2016;37(1):50-55. [DOI:10.1055/s-0035-1549923]
46. Fourchet F, Kelly L, Horobeanu C, Loepelt H, Taiar R, Millet G. High-intensity running and plantar-flexor fatigability and plantar-pressure distribution in adolescent runners. Journal of Athletic Training. 2015;50(2):117-125. [DOI:10.4085/1062-6050-49.3.90]
47. Weist R, Eils E, Rosenbaum D. The influence of muscle fatigue on electromyogram and plantar pressure patterns as an explanation for the incidence of metatarsal stress fractures. The American Journal of Sports Medicine. 2004;32(8):1893-1898. [DOI:10.1177/0363546504265191]
48. Willems TM, De Ridder R, Roosen P. The effect of fatigue on plantar pressure distribution during running in view of running injuries. Journal of Foot and Ankle Research. 2012;5(Suppl 1):P33. [DOI:10.1186/1757-1146-5-S1-P33]
49. Abdollahi. Studying the effect of fatigue on balance, proprioception, and plantar pressure distribution pattern in girls over 18 years old with scoliosis. Research Ethics Working Group, Shahrood University of Technology; 2025.
50. Naderi A, Zagatto AM, Akbari F, Sakinepoor A. Body composition and lipid profile of regular recreational table tennis participants: a cross-sectional study of older adult men. Sport Sciences for Health. 2018;14(2):265-274. [DOI:10.1007/s11332-017-0422-1]
51. Gefen A. Biomechanical analysis of fatigue-related foot injury mechanisms in athletes and recruits during intensive marching. Medical and Biological Engineering and Computing. 2002;40(3):302-310. [DOI:10.1007/BF02344212]
52. Yan SH, Zhang K, Tan GQ, Yang J, Liu ZC. Effects of obesity on dynamic plantar pressure distribution in Chinese prepubescent children during walking. Gait & Posture. 2013;37(1):37-42. [DOI:10.1016/j.gaitpost.2012.05.018]
53. Butterworth PA, Urquhart DM, Landorf KB, Wluka AE, Cicuttini FM, Menz HB. Foot posture, range of motion and plantar pressure characteristics in obese and non-obese individuals. Gait & Posture. 2015;41(2):465-469. [DOI:10.1016/j.gaitpost.2014.11.010]
54. Zhao X, Tsujimoto T, Kim B, Katayama Y, Ogiso K, Takenaka M, et al. Does weight reduction affect foot structure and the strength of the muscles that move the ankle in obese Japanese adults? The Journal of Foot and Ankle Surgery. 2018;57(2):281-284. [DOI:10.1053/j.jfas.2017.09.010]
55. Da Rocha ES, Bratz DTK, Gubert LC, de David A, Carpes FP. Obese children experience higher plantar pressure and lower foot sensitivity than non-obese. Clinical Biomechanics. 2014;29(7):822-827. [DOI:10.1016/j.clinbiomech.2014.05.006]
56. Willson JD, Kernozek TW. Plantar loading and cadence alterations with fatigue. Medicine & Science in Sports & Exercise. 1999;31(12):1828-1833. [DOI:10.1097/00005768-199912000-00020]
57. Wearing SC, Grigg NL, Lau HC, Smeathers JE. Footprint-based estimates of arch structure are confounded by body composition in adults. Journal of Orthopaedic Research. 2012;30(8):1351-1354. [DOI:10.1002/jor.22058]
58. Menz HB, Fotoohabadi MR, Munteanu SE, Zammit GV, Gilheany MF. Plantar pressures and relative lesser metatarsal lengths in older people with and without forefoot pain. Journal of Orthopaedic Research. 2013;31(3):427-433. [DOI:10.1002/jor.22229]
59. Anbarian M, Esmaeili H. The effect of running-induced fatigue on foot roll-over pattern in novice runners. Journal of Paramedical Sciences & Rehabilitation. 2016;5(4):23-32.
60. Bisiaux M, Moretto P. The effects of fatigue on plantar pressure distribution in walking. Gait & Posture. 2008;28(4):693-698. [DOI:10.1016/j.gaitpost.2008.05.009]
61. Jacob H. Forces acting in the forefoot during normal gait: an estimate. Clinical Biomechanics. 2001;16(9):783-792. [DOI:10.1016/S0268-0033(01)00070-5]
62. Garrow AP, Papageorgiou A, Silman AJ, Thomas E, Jayson M, Macfarlane GJ. The grading of hallux valgus: the Manchester Scale. Journal of the American Podiatric Medical Association. 2001;91(2):74-78. [DOI:10.7547/87507315-91-2-74]
63. Thijs Y, De Clercq D, Roosen P, Witvrouw E. Gait-related intrinsic risk factors for patellofemoral pain in novice recreational runners. British Journal of Sports Medicine. 2008;42(6):466-471. [DOI:10.1136/bjsm.2008.046649]
64. Powers CM, Chen PY, Reischl SF, Perry J. Comparison of foot pronation and lower extremity rotation in persons with and without patellofemoral pain. Foot & Ankle International. 2002;23(7):634-640. [DOI:10.1177/107110070202300709]
65. Willems T, Witvrouw E, Delbaere K, De Cock A, De Clercq D. Relationship between gait biomechanics and inversion sprains: a prospective study of risk factors. Gait & Posture. 2005;21(4):379-387. [DOI:10.1016/j.gaitpost.2004.04.002]
66. Redmond AC, Crosbie J, Ouvrier RA. Development and validation of a novel rating system for scoring standing foot posture: the Foot Posture Index. Clinical Biomechanics. 2006;21(1):89-98. [DOI:10.1016/j.clinbiomech.2005.08.002]
67. Elliot B, Ackland T. Biomechanical effects of fatigue on 10,000 meter running technique. Research Quarterly for Exercise and Sport. 1981;52(2):160-166. [DOI:10.1080/02701367.1981.10607853]
68. Hreljac A. Etiology, prevention, and early intervention of overuse injuries in runners: a biomechanical perspective. Physical Medicine and Rehabilitation Clinics of North America. 2005;16(3):651-667. [DOI:10.1016/j.pmr.2005.02.002]
69. Menz HB, Munteanu SE. Validity of 3 clinical techniques for the measurement of static foot posture in older people. Journal of Orthopaedic & Sports Physical Therapy. 2005;35(8):479-486. [DOI:10.2519/jospt.2005.35.8.479]
70. Riddle DL, Pulisic M, Pidcoe P, Johnson RE. Risk factors for plantar fasciitis: a matched case-control study. The Journal of Bone and Joint Surgery. American Volume. 2003;85(5):872-877. [DOI:10.2106/00004623-200305000-00015]
71. Karabay N, Toros T, Hurel C. Ultrasonographic evaluation in plantar fasciitis. The Journal of Foot and Ankle Surgery. 2007;46(6):442-446. [DOI:10.1053/j.jfas.2007.08.006]
72. Mickle KJ, Steele JR, Munro BJ. Does excess mass affect plantar pressure in young children? International Journal of Pediatric Obesity. 2006;1(3):183-188. [DOI:10.1080/17477160600881734]
73. Rice H, Nunns M, House C, Fallowfield J, Allsopp A, Dixon S. High medial plantar pressures during barefoot running are associated with increased risk of ankle inversion injury in Royal Marine recruits. Gait & Posture. 2013;38(4):614-618. [DOI:10.1016/j.gaitpost.2013.02.001]
74. Mei-Dan O, Kahn G, Zeev A, Rubin A, Constantini N, Even A, et al. The medial longitudinal arch as a possible risk factor for ankle sprains: a prospective study in 83 female infantry recruits. Foot & Ankle International. 2005;26(2):180-183. [DOI:10.1177/107110070502600211]
75. Nagel A, Fernholz F, Kibele C, Rosenbaum D. Long distance running increases plantar pressures beneath the metatarsal heads: a barefoot walking investigation of 200 marathon runners. Gait & Posture. 2008;27(1):152-155. [DOI:10.1016/j.gaitpost.2006.12.012]
76. Mesquita PR, Neri SGR, Lima RM, Carpes FP, de David AC. Childhood obesity is associated with altered plantar pressure distribution during running. Gait & Posture. 2018;62:202-205. [DOI:10.1016/j.gaitpost.2018.03.025]
77. Song-Hua Y, Lu W, Kuan Z. Effects of different movement modes on plantar pressure distribution patterns in obese and non-obese Chinese children. Gait & Posture. 2017;57:28-34. [DOI:10.1016/j.gaitpost.2017.05.001]
78. Hamzavi B, Esmaeili H. Effects of running-induced fatigue on plantar pressure distribution in runners with different strike types. Gait & Posture. 2021;88:132-137. [DOI:10.1016/j.gaitpost.2021.05.018]
79. Riddiford-Harland DL, Steele JR, Cliff DP, Okely AD, Morgan PJ, Jones RA, et al. Lower activity levels are related to higher plantar pressures in overweight children. Medicine & Science in Sports & Exercise. 2015;47(2):357-362. [DOI:10.1249/MSS.0000000000000403]
80. Mueller S, Carlsohn A, Mueller J, Baur H, Mayer F. Influence of obesity on foot loading characteristics in gait for children aged 1 to 12 years. PLOS ONE. 2016;11(2):e0149924. [DOI:10.1371/journal.pone.0149924]
81. Pau M, Galli M, Crivellini M, Albertini G. Relationship between obesity and plantar pressure distribution in youths with Down syndrome. American Journal of Physical Medicine & Rehabilitation. 2013;92(10):889-897. [DOI:10.1097/PHM.0b013e3182922ff1]
82. Steinberg N, Rubinstein M, Nemet D, Ayalon M, Zeev A, Pantanowitz M, et al. Effects of a program for improving biomechanical characteristics during walking and running in children who are obese. Pediatric Physical Therapy. 2017;29(4):330-340. [DOI:10.1097/PEP.0000000000000440]
83. Hausswirth C, Bigard A, Guezennec C. Relationships between running mechanics and energy cost of running at the end of a triathlon and a marathon. International Journal of Sports Medicine. 1997;18(5):330-339. [DOI:10.1055/s-2007-972642]
84. Mizrahi J, Verbitsky O, Isakov E, Daily D. Effect of fatigue on leg kinematics and impact acceleration in long distance running. Human Movement Science. 2000;19(2):139-151. [DOI:10.1016/S0167-9457(00)00013-0]
| Rights and permissions | |
 |
This work is licensed under a Creative Commons Attribution-NonCommercial 4.0 International License. |

Journal of Sport Biomechanics
Department of Sport Biomechanics, Faculty of Humanities, Islamic Azad University, Hamedan Branch, Prof. Mousivand Blvd, Imam Khomeini Blvd, Hamedan, Iran.
Journal Tel: +98 81 34494042
Website: http://biomechanics.iauh.ac.ir
Email: sportbiomechanics@iauh.ac.ir
