

Volume 12, Issue 4 (2-2027)
J Sport Biomech 2027, 12(4): 662-689 |
Back to browse issues page




Download citation:
BibTeX | RIS | EndNote | Medlars | ProCite | Reference Manager | RefWorks
Send citation to:


BibTeX | RIS | EndNote | Medlars | ProCite | Reference Manager | RefWorks
Send citation to:
Honi S F. The Effect of an Exercise-Based Rehabilitation Program on Biomechanical Performance and Functional Movement in Athletes with Chronic Ankle Instability. J Sport Biomech 2027; 12 (4) :662-689
URL: http://biomechanics.iauh.ac.ir/article-1-552-en.html
URL: http://biomechanics.iauh.ac.ir/article-1-552-en.html


Wasit Education Directorate, Open Educational College Wasit Study Center, Wasit, Iraq.
Full-Text [PDF 1570 kb]
(21 Downloads)
| Abstract (HTML) (50 Views)

Full-Text: (27 Views)
Introduction
Knee and ankle injuries are two of the most prevalent injuries in sports; however, lateral ankle sprains (LAS) are among the most common lower-limb injuries and contribute substantially to missed training sessions and competitions. According to previous studies, approximately 40% of individuals who sustain an acute LAS may eventually develop chronic ankle instability (CAI), a condition associated with a range of symptoms, including a sensation of the joint giving way, recurrent sprains, and reduced functional confidence (1, 2). The effects extend beyond pain alone; CAI can lead to changes in the body's neuromuscular and structural systems, making it extremely difficult for athletes to return to their previous level of performance (3). CAI stems from deficiencies in both static and dynamic stabilizing mechanisms. Research in this field confirms that athletes with CAI exhibit clear biomechanical deficits, including abnormal kinematic changes in the lower-limb joints even during simple movements such as walking, as well as increased ankle inversion during high-demand activities such as landing, which may lead to reinjury of the joint (4, 5). Muscular imbalance, particularly in ankle stabilizers such as the evertors and dorsiflexors, represents a significant deficit. This muscular imbalance can be measured using isokinetic dynamometry, which is considered the gold standard for assessing muscular strength imbalances (6). In addition, deficits in sensorimotor function result in a significant reduction in dynamic balance, which can be measured using the Y-Balance Test (YBT), as well as impaired functional movement ability. Poor functional movement ability increases the risk of secondary injury to other joints, such as the knee and hip (7, 8).
Current reviews indicate that isolated approaches, such as balance exercises, are effective in improving postural control in individuals with CAI (9). Nevertheless, the research problem lies in the fact that most conventional programs focus on only one parameter and overlook a comprehensive approach that combines precise changes in joint biomechanics with improvements in overall body function. This is evident from the lack of randomized controlled trials (RCTs) employing a progressive and comprehensive rehabilitation program that incorporates mobility, deep proprioception, strength, and neuromuscular control, combined with the assessment of outcomes using a variety of tools ranging from simple two-dimensional motion analysis, such as Kinovea, to comprehensive functional assessment tools, such as the FMS. Therefore, a scientific question remains as to whether this type of approach can actually produce differences in biomechanical and functional performance (10, 11). Accordingly, the present study examines whether an 8-week exercise-based rehabilitation program, delivered three times per week, can enhance biomechanical and functional performance in athletes with CAI. Biomechanical outcomes include ankle joint kinematics and isokinetic muscle strength, whereas functional performance is evaluated using the YBT and FMS. The effects of the intervention are determined by comparing changes in the EG, which participated in the rehabilitation program, with those observed in the CG, which continued its usual activities.
It was hypothesized that the EG would demonstrate statistically significant improvements in post-test measurements compared with pre-test measurements and with the CG across all study variables. These improvements were expected to include changes in ankle kinematic angles, increases in isokinetic muscle torque, higher YBT scores, and enhanced total FMS scores, thereby confirming the efficacy of the comprehensive rehabilitation program in restoring biomechanical and functional stability. The scientific novelty of this research lies in the use of a multidimensional evaluation approach that connects micromechanical changes at the joint level, assessed using Kinovea and dynamometry, with macromotor changes at the whole-body level, assessed using the FMS. Although recent consensus statements have recommended comprehensive evaluation of athletes to better understand injury mechanisms, very few studies have used a specific rehabilitation protocol and subsequently evaluated its effects across these four dimensions (12, 13). The use of the FMS as a method for evaluating movement quality both globally and locally within a biomechanical context offers an interesting approach to examining how the effects of rehabilitation are translated from the injury site to the entire kinematic chain. This research is significant because it provides scientifically supported evidence regarding the effectiveness of an applied rehabilitation program that is practical for use in gyms and requires simple equipment, such as resistance bands and instability training devices. The program can be used by coaches and sports rehabilitation practitioners to address the underlying causes of ankle instability. The results of this research will not only help improve athletic performance and prevent injuries but will also establish certain standards that may facilitate the use of assessment tools, including Kinovea, the FMS, and the YBT, to monitor progress.
Methods
Study Design
The study employed a single-blind randomized controlled trial (RCT) design to evaluate the effects of an exercise-based rehabilitation program on biomechanical and functional performance among athletes with CAI. The trial was conducted from 2 January 2026 to 27 February 2026. The study was not prospectively registered in a clinical trial registry prior to the commencement of participant recruitment. Ethical clearance was granted by the Institutional Review Board of the College of Physical Education and Sport Sciences, University of Wasit (Approval Code: WAST-2026-01).
Participants
A total of 30 male athletes actively involved in court- and field-based team sports, including football, basketball, and volleyball, were screened for eligibility at local sports clubs. Six athletes were excluded because they did not meet the predefined eligibility criteria, resulting in 24 eligible participants who were enrolled in the study. The participants had a mean age of 21.5 ± 2.3 years, height of 178.4 ± 6.2 cm, and body mass of 75.8 ± 8.1 kg. All participants provided written informed consent before participation. To ensure a controlled and homogeneous sample, all participants were required to meet the criteria for CAI recommended by the International Ankle Consortium: (a) a history of at least one significant acute lateral ankle sprain occurring at least 12 months before participation; (b) a history of ankle “giving way” or recurrent ankle sprain, defined as at least two episodes within the previous 6 months; (c) a subjective feeling of ankle instability; and (d) a score of ≤24 on the Cumberland Ankle Instability Tool (CAIT). Participants were required to be physically active for at least 150 min per week. Exclusion criteria included a history of lower-limb fracture or surgical procedures, an ankle injury within the previous 3 months, and vestibular or visual disorders that could affect balance performance. Following eligibility screening and baseline assessment, the 24 eligible participants were randomly allocated, using a computer-generated randomization sequence, to either the experimental group (EG; n = 12) or the control group (CG; n = 12). Allocation concealment was maintained using sequentially numbered, opaque, sealed envelopes. All participants had unilateral CAI. The involved limb was defined as the symptomatic ankle identified by the participant as the unstable limb and meeting the predefined CAI eligibility criteria. The involved limb was consistently used for all biomechanical, strength, balance, and functional assessments at both pre-test and post-test. Participants with bilateral CAI were not included in the study. The required sample size was determined a priori using G*Power software (version 3.1.9.7, Germany). The calculation was based on a repeated-measures ANOVA with a within–between interaction, assuming a moderate effect size (f = 0.25) consistent with previous research (14), an alpha level of 0.05, and a statistical power of 80% (1 − β = 0.80). This analysis indicated that at least 22 participants were required. To account for potential attrition during the intervention period, 24 participants were recruited. Following the baseline assessment, participants were randomly assigned to either the EG (n = 12) or CG (n = 12) using a computer-generated randomization sequence. Group assignments were concealed in sequentially prepared, opaque, sealed envelopes. The assessors responsible for biomechanical and functional measurements were blinded to participants’ group allocation; however, blinding of the participants and treating therapist was not feasible because of the nature of the intervention. Baseline characteristics of the EG and CG are presented descriptively in Table 1. The groups had comparable pre-test values across the biomechanical and functional outcomes. Baseline values were not subjected to statistical significance testing, consistent with recommendations for reporting randomized controlled trials. The corresponding pre-test values were subsequently entered as covariates in the ANCOVA models to adjust the post-test comparisons for baseline values.
Table 1. Baseline Descriptive Characteristics of the Experimental and Control Groups
Note. Values are presented as mean ± standard deviation (SD). Baseline values are presented descriptively and were not subjected to significance testing.
Outcome Measures and Testing Procedures
All tests performed before and after the eight-week intervention were conducted in a laboratory setting, with adequate rest between different tests to minimize any potential effect of fatigue on the outcomes. Before testing, all participants completed a 5-min warm-up on a stationary cycle ergometer.
Ankle Joint Kinematics
Sagittal-plane ankle kinematics were assessed during a single-leg forward drop jump from a standardized 30-cm box. Participants stepped off the box using the uninvolved limb, landed on the involved limb, and immediately performed a maximal vertical jump. The involved limb was defined a priori as the symptomatic and unstable limb that met the predefined criteria for unilateral CAI, and the same limb was assessed during all pre- and post-test measurements. A digital video camera (Sony FDR-AX43, Japan), recording at 60 frames/s, was positioned perpendicular to the sagittal plane of the tested limb on a standardized tripod, with the optical axis aligned approximately with the level of the ankle joint. The camera was positioned at a standardized distance of 3.0 m from the participant, and the camera height and orientation were kept constant across all participants and testing sessions. The recording area was calibrated using a 1-m rigid calibration rod placed within the movement plane before data collection. Reflective markers were affixed to predefined anatomical reference points, namely the lateral femoral epicondyle, lateral malleolus, calcaneal tuberosity, and fifth metatarsal head. These markers were used to establish the shank and foot segments and to derive the ankle joint angle in the sagittal plane. The ankle angle was calculated as the angle formed between the longitudinal axes of the shank and foot, with larger values indicating a greater degree of ankle dorsiflexion. Identical anatomical marker placement criteria and camera settings were applied consistently across all participants and assessment sessions. The landing phase was considered to begin at the first instance of foot–ground contact and to end at the point of maximum vertical displacement of the center of mass during the landing sequence, immediately before the subsequent maximal vertical jump. Peak ankle dorsiflexion was operationally defined as the greatest sagittal-plane dorsiflexion angle recorded within this interval. Frame-by-frame video analysis was used to identify the frame corresponding to this maximum value, which was subsequently documented as the peak dorsiflexion angle. Video recordings were analyzed frame-by-frame using Kinovea software (version 0.9.3). No additional digital smoothing filter was applied in order to preserve the raw kinematic spatial coordinates, and the anatomical landmarks were manually digitized by the assessor. Three successful trials were recorded for each participant, with adequate recovery between trials, and the mean peak dorsiflexion angle across the three trials was used for statistical analysis.
A trial was considered successful when the participant completed the prescribed drop-jump sequence and maintained contact with the designated testing area without an obvious loss of balance or additional foot contact. The assessor who performed the video digitization was blinded to group allocation. To assess intra-rater reliability, the assessor re-digitized a randomly selected subset of 20% of the video recordings (n = 8) one week after the initial analysis. Intraclass correlation coefficients (ICC) were calculated, demonstrating excellent intra-rater reliability for the peak ankle dorsiflexion angle (ICC = 0.94, 95% CI: 0.85–0.98). Because drop-jump exercises were incorporated during the final phase of the rehabilitation program and the same task was subsequently used for biomechanical outcome assessment, a task-specific practice or familiarization effect cannot be completely excluded. Therefore, it is possible that improvements in ankle biomechanics and familiarity with the drop-jump task were partially responsible for the observed increase in peak ankle dorsiflexion.
Isokinetic Muscle Strength
Ankle isokinetic muscle strength was assessed using a Biodex System 4 Pro dynamometer (Biodex Medical Systems, Inc., Shirley, NY, USA). Participants were positioned in the dynamometer chair with the hip flexed to approximately 80° and the test knee fully extended (0°). The trunk, pelvis, and distal thigh were stabilized using standardized straps to minimize compensatory movements. The dynamometer attachment was positioned and aligned with the anatomical axis of ankle inversion–eversion, and the foot was securely fixed to the appropriate footplate according to the manufacturer’s positioning guidelines. The alignment was checked before each test to ensure consistent positioning of the ankle joint and dynamometer axis. Before testing, the dynamometer was calibrated according to the manufacturer’s standard procedures, and gravity correction was performed with the tested limb positioned in the test apparatus. Participants completed a standardized familiarization procedure consisting of three submaximal practice actions to minimize learning effects. The test consisted of five maximal concentric inversion and eversion actions at an angular velocity of 60°/s, with 60 s of rest between testing bouts. Verbal encouragement was provided during each maximal effort. Peak torque was recorded in N·m. The involved limb was tested consistently in accordance with the predefined definition of the symptomatic and unstable limb. Because all participants had unilateral CAI, the same involved limb was used for the pre-test and post-test assessments. The previously stated procedure of testing the limb that had not undergone surgery was removed because participants with a history of lower-limb surgery were excluded from the study. Both inversion and eversion were assessed during the isokinetic testing procedure; however, evertor peak torque at 60°/s was the prespecified isokinetic outcome included in the statistical analysis because the rehabilitation program and primary outcome assessment focused on ankle evertor strength as an indicator of dynamic lateral ankle stability. Invertor strength was not included in the statistical analysis or reported as a study outcome.
Dynamic Balance
Dynamic postural stability was assessed using the Y-Balance Test Kit (Move2Perform, USA) according to standardized procedures (15, 16). Participants stood barefoot on the involved limb at the center of the testing platform, with their hands placed on their hips. Lower-limb length was measured in the supine position from the anterior superior iliac spine to the most distal point of the medial malleolus before testing. Participants were instructed to reach as far as possible with the contralateral limb in three directions: anterior (ANT), posterolateral (PL), and posteromedial (PM). Reach distances were recorded in centimeters. A trial was considered invalid if the participant lost balance, transferred weight onto the reaching limb, or lifted the stance foot from the platform. Participants performed three familiarization trials in each direction before the formal assessment, followed by three recorded trials in each direction. The composite reach score was calculated as the sum of the maximum reach distances in the three directions, normalized to limb length and expressed as a percentage. Because Y-Balance exercises were incorporated into the rehabilitation program and the Y-Balance Test was subsequently used as an outcome measure, the possibility of a task-specific practice effect cannot be excluded. Therefore, improvements in the Y-Balance composite score may partly reflect familiarity with the assessment task in addition to changes in dynamic postural control.
Functional Movement
Fundamental movement patterns were assessed using the FMS tests and a standardized FMS kit (17). The seven FMS tests were administered in a standardized manner by an FMS-certified examiner. Each of the seven tests was scored using a discrete scale from 0 to 3, where a score of 0 indicated pain associated with performance of the movement. The composite score out of 21, as well as any asymmetry between the two sides of the body, was recorded. With regard to the pathology of this particular population, the analysis primarily focused on the scores obtained from the Deep Squat, Hurdle Step, and In-line Lunge assessments.
Intervention Protocol
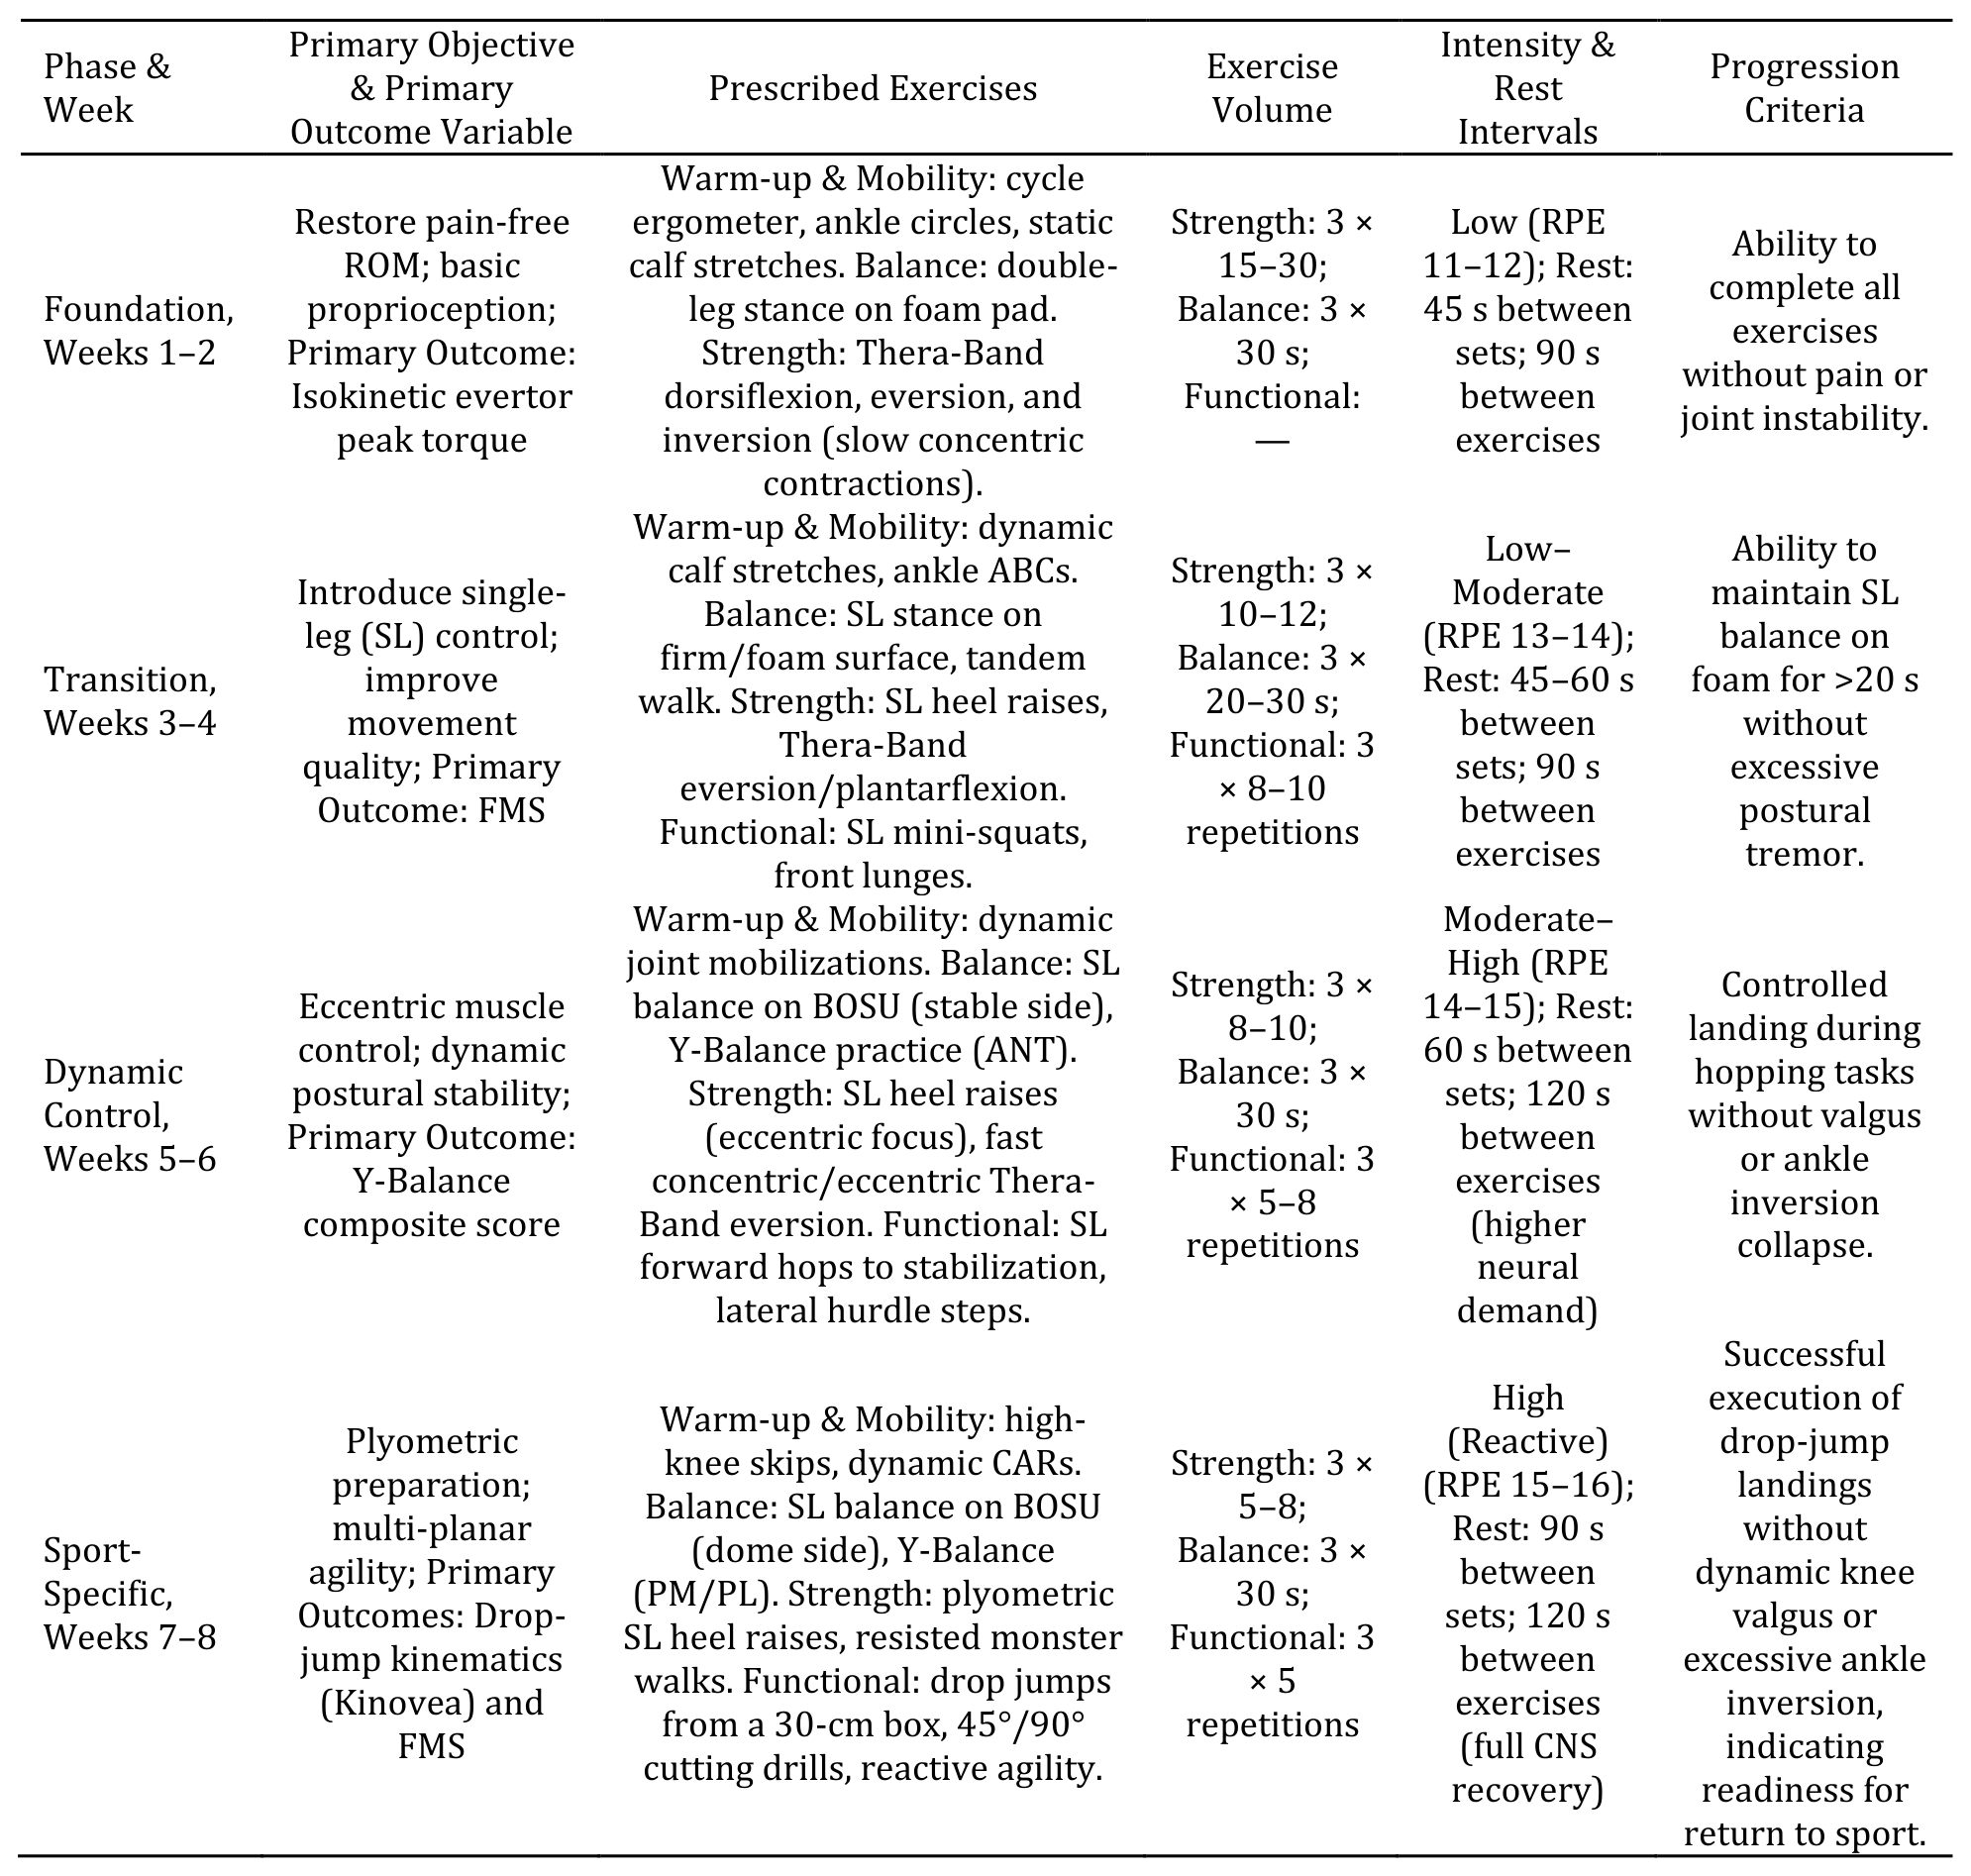
Participants assigned to the EG underwent a supervised, structured exercise-based rehabilitation program for 8 weeks, comprising 24 training sessions (3 sessions per week). All sessions were supervised by a sports rehabilitation specialist, and each session lasted approximately 50–60 min. The program was developed using a progressive periodization approach to systematically address the underlying impairments associated with CAI. Standard training equipment, including resistance bands, foam pads, BOSU, agility ladders, and step boxes, was used to facilitate the prescribed exercises. Exercise intensity and progression were monitored throughout the intervention, and the training load or exercise pace was reduced when participants reported an increase in pain exceeding 2/10 on the visual analog scale. The detailed micro-periodization, including exercise prescription, target variables, volume, intensity, rest intervals, and progression criteria, is presented in Table 2. All participants in the EG completed the full 24-session rehabilitation program, corresponding to 100% adherence. No participant discontinued the intervention, and no adverse events or exercise-related complications were recorded during the 8-week intervention period. The prescribed exercises were performed as planned, and no major modifications to the exercise protocol were required. Any minor adjustments in exercise intensity or pace were made according to individual tolerance and clinical response without changing the prescribed exercise objectives or progression structure. The CG continued their usual sport-specific training and daily physical activities during the same 8-week period and did not receive the structured exercise-based rehabilitation program. Participants in the CG were instructed not to initiate additional ankle-specific rehabilitation or proprioceptive training during the intervention period. The frequency, duration, and content of their usual training activities were not experimentally standardized or controlled. Consequently, individual differences in training exposure and concurrent physical activity may have existed among participants in the CG and were considered a potential source of uncontrolled variability.
Statistical Analysis
Statistical analyses were performed using SPSS Statistics for Windows (Version 26.0, IBM Corp., Armonk, NY, USA). The Shapiro–Wilk test was used to assess the normality of the data, while Levene’s test was applied to examine the homogeneity of variances. Data are reported as means with corresponding standard deviations (SD). For each dependent variable, a one-way analysis of covariance (ANCOVA) was conducted to compare post-test outcomes between the EG and CG, with the corresponding pre-test score entered as a covariate to adjust for baseline values. Adjusted post-test means and their 95% confidence intervals (CIs) were reported for both groups. Effect sizes were expressed as partial eta squared (η²p), with values of 0.01, 0.06, and 0.14 interpreted as small, medium, and large effects, respectively. Statistical significance was set at p < 0.05. Although individual FMS items are scored on an ordinal 0–3 scale, the present analysis used the total FMS score (range: 0–21), which represents the sum of seven movement-pattern scores. The total score was treated as a continuous outcome for the purposes of the ANCOVA because it provides a composite measure across multiple movement domains and was analyzed as an approximately continuous summary measure. This approach was applied consistently to the pre-test and post-test total scores.
Table 2. Progressive Eight-Week Exercise-Based Rehabilitation Program for Athletes with CAI
Note. ANT = anterior; CNS = central nervous system; CON = concentric contraction; ECC = eccentric contraction; PL = posterolateral; PM = posteromedial; ROM = range of motion; RPE = rating of perceived exertion (Borg 6–20 scale); SL = single-leg. Each rehabilitation session lasted approximately 50–60 minutes and was performed three times per week for eight weeks under the supervision of a certified sports rehabilitation specialist. The CG continued their usual sport-specific training and daily physical activities during the 8-week study period and did not receive the structured exercise-based rehabilitation program provided to the EG. Participants in the CG were instructed not to initiate any additional ankle-specific rehabilitation or proprioceptive training during the intervention period. However, the frequency, duration, and content of their usual training activities were not experimentally standardized or controlled, reflecting their normal training routines. Exercise intensity and progression were individualized according to each participant's tolerance, clinical response, and functional performance.
Results
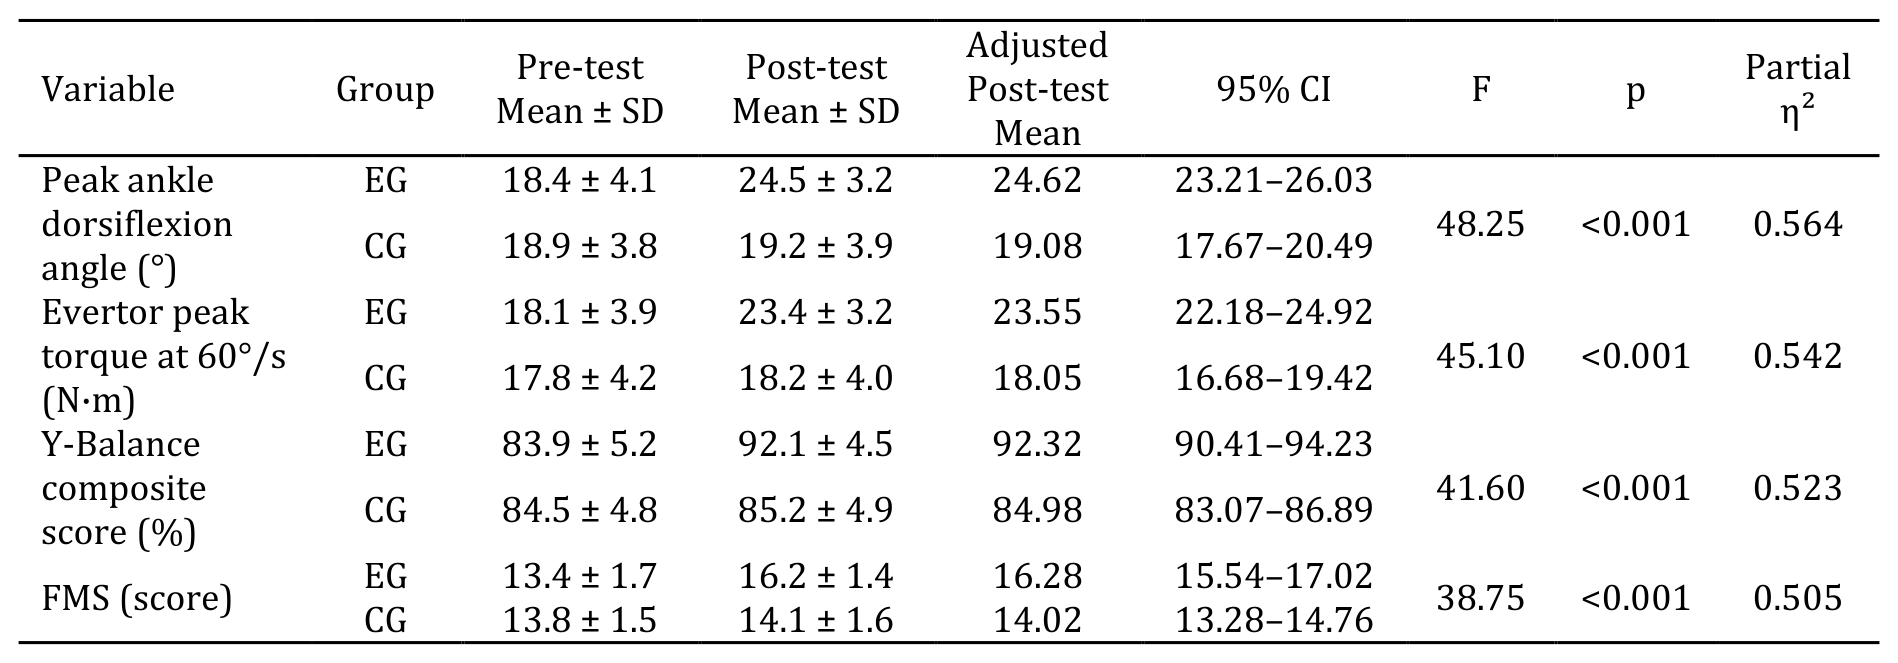
Preliminary analyses confirmed that the assumptions required for the planned parametric analyses were satisfied. Specifically, the Shapiro–Wilk test indicated that the data were normally distributed, while Levene’s test confirmed the homogeneity of variance across the dependent variables. Accordingly, a one-way analysis of covariance (ANCOVA) was performed for each dependent variable to compare post-test outcomes between the EG and CG while adjusting for the corresponding pre-test scores. All 24 randomized athletes completed the 8-week intervention period and were included in the per-protocol analysis. Descriptive statistics (mean ± SD), adjusted post-test means, 95% confidence intervals (CIs), and ANCOVA results for all biomechanical and functional variables are presented in Table 3. The results for each outcome are described separately below.
Biomechanical Performance
Following adjustment for the corresponding baseline measurements, ANCOVA demonstrated a significant between-group effect on peak ankle dorsiflexion during the drop-jump landing task (F = 48.25, p < 0.001, η²p = 0.564). The estimated marginal mean for the post-test dorsiflexion angle was 24.62° (95% CI: 23.21–26.03) in the EG, compared with 19.08° (95% CI: 17.67–20.49) in the CG. A significant group effect was also found for isokinetic evertor peak torque measured at 60°/s after controlling for baseline values (F = 45.10, p < 0.001, η²p = 0.542). The adjusted post-test torque values were 23.55 N·m (95% CI: 22.18–24.92) for the EG and 18.05 N·m (95% CI: 16.68–19.42) for the CG. The EG exhibited greater adjusted post-intervention values for both biomechanical measures than the CG, as reported in Table 3.
Functional Performance
After controlling for the respective baseline values, ANCOVA demonstrated a statistically significant difference between the EG and CG in the post-test Y-Balance composite score (F = 41.60, p < 0.001, η²p = 0.523). The estimated marginal mean was 92.32% (95% CI: 90.41–94.23) in the EG, compared with 84.98% (95% CI: 83.07–86.89) in the CG. A significant between-group effect was also identified for the post-test FMS total score following adjustment for baseline performance (F = 38.75, p < 0.001, η²p = 0.505). The corresponding adjusted means were 16.28 points (95% CI: 15.54–17.02) for the EG and 14.02 points (95% CI: 13.28–14.76) for the CG. Overall, the adjusted post-test values were higher in the EG for both dynamic postural control and functional movement performance, as shown in Table 3.
Table 3. ANCOVA Results for Post-Test Outcomes Adjusted for Pre-Test Scores
Note. EG = experimental group; CG = control group; CI = confidence interval; FMS = Functional Movement Screen; partial η² = partial eta squared. F-values represent the between-group effect from ANCOVA with the corresponding pre-test score entered as the covariate. Adjusted post-test means are estimated marginal means.
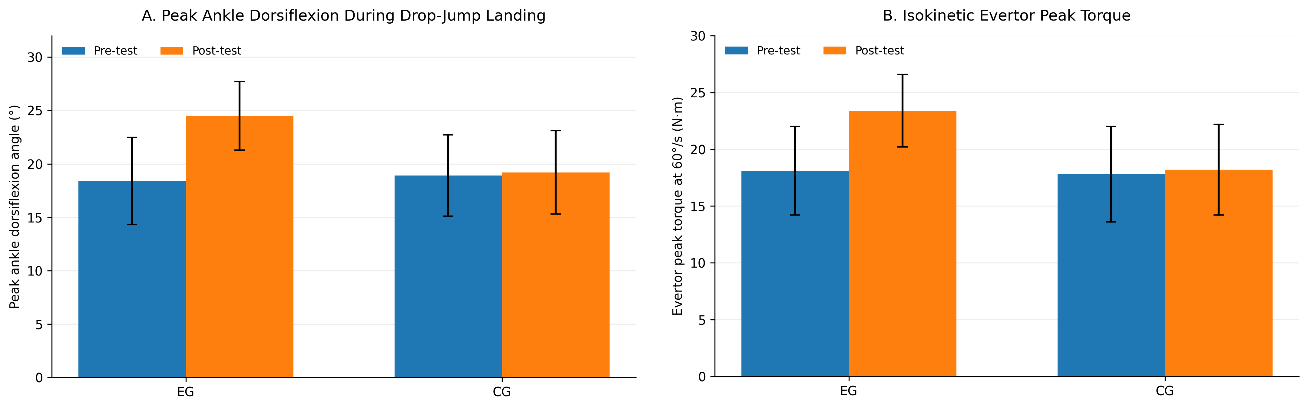
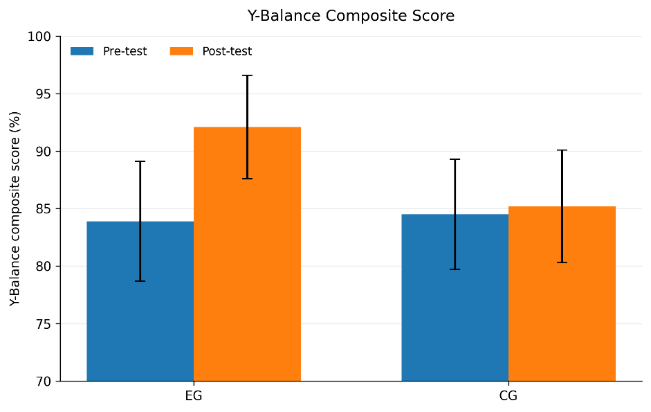
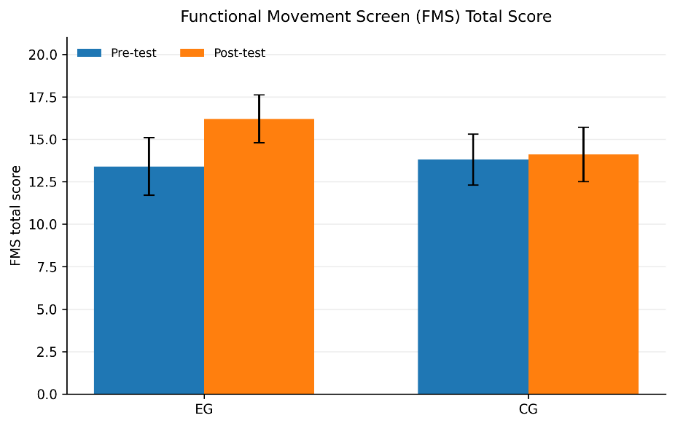
Graphical representations in Figures 1–3 illustrate the observed changes in the study outcomes before and after the 8-week exercise-based rehabilitation program. Fig. 1 shows increases in both peak ankle dorsiflexion angle and evertor peak torque at 60°/s in the EG, whereas only minor changes were observed in the CG. Fig. 2 illustrates an increase in the Y-Balance composite score in the EG, while only a slight change was observed in the CG. Fig. 3 shows an increase in the FMS score in the EG, whereas the CG demonstrated only a slight change. The bars represent observed mean values, and the error bars represent ±1 standard deviation (SD).
Fig. 1. Pre- and post-test biomechanical outcomes in the experimental (EG) and control (CG) groups: (A) peak ankle dorsiflexion angle (°); (B) isokinetic evertor peak torque at 60°/s (N·m). Data are presented as mean ± SD.
Fig. 2. Pre- and post-test Y-Balance composite scores (%) in the experimental (EG) and control (CG) groups. Data are presented as mean ± SD.
Fig. 3. Pre- and post-test Functional Movement Screen (FMS) total scores in the experimental (EG) and control (CG) groups. Data are presented as mean ± SD.
Discussion
The most important finding of the present study was that the eight-week exercise-based rehabilitation program was associated with significant improvements in biomechanical and functional performance in athletes with CAI. After adjustment for the corresponding pre-test scores, ANCOVA demonstrated significant between-group differences in all four dependent variables, with the EG demonstrating higher adjusted post-test values than the CG. Specifically, the EG showed greater peak ankle dorsiflexion during the drop-jump landing, higher isokinetic evertor peak torque, better dynamic postural control, and improved functional movement quality compared with the CG, which continued its usual training activities. These findings suggest that a progressive, multidimensional rehabilitation program involving the gradual development of joint mobility, muscular strength, proprioception, and sport-specific neuromuscular control may be effective in improving biomechanical and functional outcomes in athletes with CAI (18).
From a biomechanical perspective, the improvement in peak ankle dorsiflexion during the landing maneuver is clinically relevant. Individuals with CAI commonly demonstrate restricted ankle dorsiflexion, which may be associated with limitations in joint arthrokinematics, increased posterior joint stiffness, or fear-avoidance behavior, potentially leading to compensatory movement patterns such as early heel rise or excessive frontal-plane motion (19). In the present study, the improvement may be attributable to the initial stages of the rehabilitation program, which emphasized ankle mobilization and calf-muscle flexibility, followed by the progressive introduction of drop-jump landing tasks. Task-specific loading may have facilitated sensorimotor adaptation and improved feed-forward motor control, enabling participants to absorb ground-reaction forces through a greater sagittal-plane range of motion rather than relying on potentially undesirable compensatory strategies (20). Concomitantly, the EG demonstrated greater isokinetic evertor peak torque at 60°/s than the CG following the intervention. This finding addresses a muscular deficit that has been well documented in individuals with CAI. Reduced ankle-evertor strength may compromise dynamic joint stability by limiting the ability of the musculature to resist inversion forces during cutting and landing activities (21). The progressive overload incorporated into the rehabilitation protocol, progressing from controlled concentric Thera-Band exercises to more demanding eccentric exercises, may have contributed to improved muscular capacity and neuromuscular control. Enhanced evertor strength may contribute to improved control of ankle mechanics during dynamic tasks by providing greater resistance to excessive inversion and supporting functional lower-limb stability (22).
With regard to dynamic postural control, the EG demonstrated a significantly higher adjusted post-test Y-Balance composite score than the CG. This improvement is consistent with the substantial proprioceptive and balance-oriented component of the rehabilitation protocol. Progression from stable to unstable surfaces, including exercises performed on devices such as the BOSU, provides an increased somatosensory challenge that may stimulate sensory reweighting and improve postural control strategies (23). The combination of dynamic balance exercises and progressive strength training may have produced a complementary effect whereby improved muscular capacity provided a more stable mechanical foundation for the central nervous system to control greater reach distances while maintaining postural stability (24). Another important finding was the improvement in functional movement quality, as reflected by the FMS total score. The EG demonstrated a higher adjusted post-test FMS total score than the CG. The FMS evaluates fundamental movement patterns that require an interaction between proximal stability and distal mobility. CAI may alter proximal movement strategies and contribute to deficits in hip control and changes in trunk alignment during unilateral tasks, a phenomenon described as the “proximal cascade” of CAI (25). Improvements in distal ankle mobility and stability may therefore contribute to more efficient execution of whole-body movement patterns. In particular, improved dorsiflexion may facilitate more appropriate squat-related movement patterns, while enhanced lower-limb and hip stabilization during unilateral tasks may contribute to better performance on movement patterns such as the hurdle step (26).
The clinical relevance of these findings is also noteworthy. The study employed accessible and clinically applicable assessment methods, including two-dimensional motion analysis using Kinovea to assess landing mechanics, isokinetic dynamometry to quantify muscular strength, and the Y-Balance and FMS tests to evaluate dynamic postural control and global movement quality. Two-dimensional motion analysis has previously demonstrated utility for discriminating biomechanical performance in athletic populations (27). More importantly, the present findings indicate that a structured, progressive rehabilitation program can produce substantial between-group differences across multiple biomechanical and functional outcomes within an eight-week period. These findings support a rehabilitation approach that extends beyond symptom reduction and emphasizes the restoration of neuromuscular control, muscular capacity, dynamic balance, and overall movement quality. Accordingly, rehabilitation for CAI may benefit from progressing beyond the resolution of pain or basic functional symptoms toward the restoration of comprehensive movement capacity and sport-related neuromuscular function (28).
Several limitations of the present study should be acknowledged. First, the relatively small sample size and inclusion of male athletes only may limit the generalizability of the findings to female athletes and broader athletic populations with CAI. Second, ankle landing biomechanics were assessed using two-dimensional video analysis in the sagittal plane; therefore, potentially relevant frontal- and transverse-plane movements could not be evaluated. Third, the isokinetic assessment focused exclusively on concentric peak torque of the ankle evertor muscles at an angular velocity of 60°/s. Eccentric muscle function and the isokinetic torque of the ankle invertors were not evaluated. The findings provide only a partial representation of the agonist–antagonist strength balance and do not fully capture eccentric muscular control during sport-specific ankle movements. Fourth, although post-test outcomes were adjusted for baseline values using ANCOVA, the CG continued its usual training activities, which were not experimentally standardized in terms of frequency, duration, or content and may therefore have introduced uncontrolled variability between participants. Fifth, Y-Balance and drop-jump tasks were incorporated into the rehabilitation program and were subsequently used as outcome assessments. Therefore, task-specific practice or familiarization effects cannot be completely excluded, and some of the observed improvements in these outcomes may reflect increased familiarity with the testing tasks in addition to genuine changes in neuromuscular function and ankle biomechanics. Although the FMS total score was analyzed as a continuous composite outcome, its individual component scores are ordinal, which should be considered when interpreting the statistical findings. Finally, the study did not include a long-term follow-up assessment; consequently, it remains unclear whether the observed improvements in biomechanical and functional outcomes are maintained after completion of the eight-week rehabilitation program. Future research should address these limitations by recruiting larger and more diverse samples, incorporating three-dimensional biomechanical analysis, assessing both invertor and evertor muscle function under concentric and eccentric conditions across multiple angular velocities, standardizing or monitoring CG activities, and including longer-term follow-up assessments.
Conclusion
This randomized controlled trial found that an 8-week progressive, multidimensional exercise-based rehabilitation program was associated with higher post-test values across four measured outcomes in male athletes with CAI after adjustment for the corresponding pre-test scores. The EG demonstrated higher adjusted post-test values for peak ankle dorsiflexion during drop-jump landing, isokinetic evertor peak torque at 60°/s, Y-Balance composite score, and FMS total score than the CG. These findings indicate short-term improvements in the measured biomechanical and functional outcomes following the rehabilitation program. The study did not assess injury recurrence, return to sport, ground-reaction forces, or long-term maintenance of the observed changes; therefore, conclusions regarding injury prevention, return-to-sport readiness, or broader neuromuscular recovery should not be drawn. Further research with larger and more diverse samples, three-dimensional biomechanical assessments, additional measures of ankle muscle function, and long-term follow-up is warranted.
Ethical Considerations
Compliance with ethical guidelines
Ethical approval was obtained from the Institutional Review Board (IRB) of the College of Physical Education and Sport Sciences, University of Wasit (Approval Code: WAST-2026-01). Written informed consent was obtained from all participants prior to participation. All procedures were conducted in accordance with the Declaration of Helsinki, and the confidentiality and anonymity of all participants were maintained.
Funding
This study received no external funding and was fully self-funded by the author.
Authors' contributions
Soundus Farouk Honi: Conceptualization and study design; investigation; data analysis and interpretation; writing – original draft; writing – review and editing. The author read and approved the final version of the manuscript.
Conflicts of interest
The author declares no conflict of interest.
Type of Study: Research |
Subject:
General
Received: 2026/07/25 | Accepted: 2026/09/30 | Published: 2026/10/2
Received: 2026/07/25 | Accepted: 2026/09/30 | Published: 2026/10/2
References
1. Kaminski TW, Hertel J, Amendola N, Docherty CL, Dolan MG, Hopkins JT, et al. National Athletic Trainers' Association position statement: conservative management and prevention of ankle sprains in athletes. Journal of Athletic Training. 2013;48(4):528-545. [DOI:10.4085/1062-6050-48.4.02]
2. Doherty C, Delahunt E, Caulfield B, Hertel J, Ryan J, Bleakley C. The incidence and prevalence of ankle sprain injury: a systematic review and meta-analysis of prospective epidemiological studies. Sports Medicine. 2014;44(1):123-140. [DOI:10.1007/s40279-013-0102-5]
3. Maricot A, Corlùy H, De Pauw K, Lathouwers E, Meeusen R, Roelands B, et al. Deficits in neurocognitive performance in patients with chronic ankle instability during a neurocognitive balance task: a retrospective case-control study. Physical Therapy in Sport. 2024;66:1-8. [DOI:10.1016/j.ptsp.2023.12.009]
4. Wang Z, Lu M, Kong L, Meng L, Xue J, Zheng Y, et al. Impact of cognitive tasks on biomechanical adjustments during single-leg drop landings in individuals with functional ankle instability. Applied Sciences. 2024;14(22):10297. [DOI:10.3390/app142210272]
5. Asghari V, Farahpour N, Robbins S, Moisan G, Majlesi M. Kinematic changes of lower-limb joints during walking in individuals with chronic ankle instability on flat and inclined surfaces. Journal of Sport Biomechanics. 2026;12(2):302-319. [DOI:10.66224/JSportBiomech.12.2.302]
6. Uzlasir S, Tayfur B, Işıkdemir E, Tayfur A. Comparison of muscle activation and proprioception during landing at different angles between individuals with chronic ankle instability and healthy controls. BMC Musculoskeletal Disorders. 2025;26(1):929. [DOI:10.1186/s12891-025-09212-8]
7. Lao Y, Zeng Z, Yu Z, Gu Y, Jia Y, Liu J, et al. Uphill treadmill running and joint mobilization improve dynamic stability and ankle dorsiflexion range of motion in young adults with chronic ankle instability: a four-arm randomized controlled trial. Archives of Physical Medicine and Rehabilitation. 2025;106(2):177-186. [DOI:10.1016/j.apmr.2024.08.025]
8. Maeda N, Ikuta Y, Tsutsumi S, Arima S, Ishihara H, Ushio K, et al. Relationship of chronic ankle instability with foot alignment and dynamic postural stability in adolescent competitive athletes. Orthopaedic Journal of Sports Medicine. 2023;11(10):23259671231202220. [DOI:10.1177/23259671231202220]
9. Piri M, Otadi K, Shadmehr A, Malmir K. Effects of balance training on postural control in athletes with chronic ankle instability: a systematic review. Journal of Sport Biomechanics. 2022;8(3):248-264. [DOI:10.61186/JSportBiomech.8.3.248]
10. Feng SM, Luo X, Maffulli N, van Dijk CN, Oliva F, Fehske K, et al. Clinical practice guidelines for rehabilitation following surgical management of chronic lateral ankle instability: enhancing recovery based on available evidence. British Medical Bulletin. 2025;154(1):ldaf002. [DOI:10.1093/bmb/ldaf002]
11. Erdman A, Loewen A, Dressing M, Wyatt C, Oliver G, Butler L, et al. A 2D video-based assessment is associated with 3D biomechanical contributors to dynamic knee valgus in the coronal plane. Frontiers in Sports and Active Living. 2024;6:1352286. [DOI:10.3389/fspor.2024.1352286]
12. Hertel J, Corbett RO. An updated model of chronic ankle instability. Journal of Athletic Training. 2019;54(6):572-588. [DOI:10.4085/1062-6050-344-18]
13. Mohammed HM, Majed OM, Abdulkareem OW, Abdulhussein AA, Shehab GM, Kadhim MJ. Effects of an augmented motor reality-based training program on spatial awareness and skill-based decision making in youth basketball players. AIP Conference Proceedings. 2026:020019. [DOI:10.1063/12.0046265]
14. Elsotohy NM, Salim YE, Nassif NS, Hanafy AF. Cross-education effect of balance training program in patients with chronic ankle instability: a randomized controlled trial. Injury. 2021;52(3):625-632. [DOI:10.1016/j.injury.2020.09.065]
15. Hassan MFA, Abdulkareem OW. Effects of an integrated balance and muscle tension control training program on kinematic variables and defensive accuracy in volleyball players. Journal of Sport Biomechanics. 2026;11(4):438-464. [DOI:10.61882/JSportBiomech.11.4.438]
16. Zhang Y, Liu Y, Shang T, Jian L, Wang J, Abbott SD, et al. The reliability and validity of Star Performer™, a computerized tool for quantifying the Star Excursion Balance Test. International Journal of Sports Physical Therapy. 2025;20(6). [DOI:10.26603/001c.137953]
17. O'Brien W, Philpott C, Lester D, Belton S, Duncan MJ, Donovan B, et al. Motor competence assessment in physical education: convergent validity between fundamental movement skills and functional movement assessments in adolescence. Physical Education and Sport Pedagogy. 2023;28(3):306-319. [DOI:10.1080/17408989.2021.1990241]
18. Zhang C, Luo Z, Wu D, Fei J, Xie T, Su M. Effectiveness of exercise therapy on chronic ankle instability: a meta-analysis. Scientific Reports. 2025;15(1):11709. [DOI:10.1038/s41598-025-95896-w]
19. He Z, Zhu H, Ye B, Zheng Z, Liu G, Pan H, et al. Does chronic ankle instability patients lead to changes in biomechanical parameters associated with anterior cruciate ligament injury during landing? A systematic review and meta-analysis. Frontiers in Physiology. 2024;15:1428879. [DOI:10.3389/fphys.2024.1428879]
20. Hou Z, Shen W, Fong DTP, Winter SL. Anticipation of landing leg masks ankle inversion orientation deficits and peroneal insufficiency during jump landing in people with chronic ankle instability. Scandinavian Journal of Medicine & Science in Sports. 2024;34(2):e14585. [DOI:10.1111/sms.14585]
21. Aguilaniu A, Grosdent S, Schwartz C, Martens G, Croisier JL, Durieux N. Reliability and measurement error of instrument-based methods to assess ankle evertor strength: a systematic review. Journal of Sport Rehabilitation. 2026:1-19. [DOI:10.1123/jsr.2024-0424]
22. Lin CW, Jankaew A, Lin CF. Physical therapy intervention effects on alteration of spinal excitability in patients with chronic ankle instability: a systematic review and meta-analysis. Sports Health: A Multidisciplinary Approach. 2025;17(2):394-403. [DOI:10.1177/19417381241253248]
23. Hu X, Feng T, Li P, Liao J, Wang L. Bilateral sensorimotor impairments in individuals with unilateral chronic ankle instability: a systematic review and meta-analysis. Sports Medicine - Open. 2024;10(1):33. [DOI:10.1186/s40798-024-00702-y]
24. Maricot A, Lathouwers E, Verschueren J, De Pauw K, Meeusen R, Roelands B, et al. Test-retest, intra- and inter-rater reliability of the reactive balance test in patients with chronic ankle instability. Frontiers in Neurology. 2024;15:1320043. [DOI:10.3389/fneur.2024.1320043]
25. Werner D, Casey L, Myers E, Barrios JA. Lower limb squat biomechanics and select clinical measures in chronic ankle instability. Clinical Biomechanics. 2024;113:106211. [DOI:10.1016/j.clinbiomech.2024.106211]
26. Fitton Davies K, Sacko RS, Lyons MA, Duncan MJ. Association between Functional Movement Screen scores and athletic performance in adolescents: a systematic review. Sports. 2022;10(3):28. [DOI:10.3390/sports10030028]
27. Abdulkareem OW, Sattar Jabbar H. Comparative biomechanical analysis of three-point shooting between elite Iraqi basketball players and international counterparts. Journal of Sport Biomechanics. 2025;11(3):326-342. [DOI:10.61882/JSportBiomech.11.3.326]
28. Cervera-Garvi P, Marchena-Rodriguez A, Lopezosa-Reca E, Diaz-Miguel S, Ortega-Avila AB. Systematic review of the methodological quality of patient-reported outcome measure for patients with chronic ankle instability. Clinical Rehabilitation. 2023;37(10):1332-1346. [DOI:10.1177/02692155231166217]
| Rights and permissions | |
 |
This work is licensed under a Creative Commons Attribution-NonCommercial 4.0 International License. |

Journal of Sport Biomechanics
Department of Sport Biomechanics, Faculty of Humanities, Islamic Azad University, Hamedan Branch, Prof. Mousivand Blvd, Imam Khomeini Blvd, Hamedan, Iran.
Journal Tel: +98 81 34494042
Website: http://biomechanics.iauh.ac.ir
Email: sportbiomechanics@iauh.ac.ir
